Debugging in Julia - Two different ways
Creation date: 2020-10-30

Updated 14th of June 2021 I've updated this tutorial based on the new version of Infiltrator.jl v1.0.1 which solved an issue I had before 🎉
2020 is definitely the year of weirdness. My code often includes some weird parts and bugs. Thus, I want to show you several techniques on how to debug Julia code.
I'm nowhere professional in this but that holds true for everything I blog about so just keep that in mind... Well actually some of you pay for my work so I can technically call myself a professional blogger, right?
Anyway let's not get distracted in that thought. Welcome to my blog if you're new and welcome back otherwise. Good to have your computer requesting something from my server.
I'll assume that you have some basic knowledge of Julia. The following posts can give you the basics if you are interested:
Additionally, the knowledge of the basic syntax.
A code example
Before we start with debugging I want to demonstrate this on some code. It is short enough to show it here and contains at least one bug. 😉
I'll go with ProjectEuler problem #21. You can try it out yourself. This will be implementing the start of a possible naive version.
The problem is the following: We are looking for amicable numbers less 10,000. An amicable number is defined as an element of an amicable pair... A pair of two integers (a,b) is amicable iff d(a) = b and d(b) = a where d is the sum of the divisors so d(4) = 1+2 = 3.
The given amicable pair is a = 220 and b = 284. We might want to start with a function that just takes in a pair and decides whether it's amicable.
function is_amicable(a, b)
    sum_divisors(a) == b && sum_divisors(b) == a
endreturn keyword that you might expect.We then need the sum_divisors function.
function sum_divisors(a)
    result = 0
    for i = 1:a
        if a % i == 0
            result += i
        end
    end
    return result
end
Then we can call
julia> is_amicable(220, 284)
false
And see that we did something wrong. You might have seen the bug but if not, it's probably a good idea to not look for it now. Follow the journey of debugging instead. 😄
Debugging using Debugger.jl in the REPL
This post shows you two different variants of debugging and the first variant can be done in the REPL or in your IDE i.e VSCode.
In this section I'll explain how to work with the debugger on the REPL. (Debugger.jl)
julia> ] add Debugger
julia> using Debugger
You can have a look at the package manager post if this isn't clear.
julia> @enter is_amicable(220, 284)
In is_amicable(a, b) at REPL[7]:1
 1  function is_amicable(a, b)
>2      sum_divisors(a) == b && sum_divisors(b) == a
 3  end

About to run: (sum_divisors)(220)
1|debug>
I typed in @enter is_amicable(220, 284) to get that output. BTW I have just copied the two functions I defined before into the REPL. You can also create a amicable.jl file for that and use Revise and includet (see REPL and Revise.jl).
In the case of a file the line numbers are probably more helpful.
I'll be back in a second...
julia> using Revise
julia> includet("amicable.jl")
julia> using Debugger
julia> @enter is_amicable(220, 284)
In is_amicable(a, b) at /Users/olek/Code/opensources/blog/2020-10-27-basics-debugging/amicable.jl:1
 1  function is_amicable(a, b)
>2      sum_divisors(a) == b && sum_divisors(b) == a
 3  end

About to run: (sum_divisors)(220)
1|debug>
There we go. Okay now as mentioned at the end we are about to run sum_divisors(220).
The last line 1|debug> gives us the ability to investigate further by jumping around, see the lowered code and a lot of cool stuff. I'll only go into some of them so if you want to see the full list of commands -> Debugger.jl commands
? in the debugger mode and press enter to see the list of commandsLet's start with n - step to the next line.
1|debug> n
In is_amicable(a, b) at /Users/olek/Code/opensources/blog/2020-10-27-basics-debugging/amicable.jl:1
 1  function is_amicable(a, b)
>2      sum_divisors(a) == b && sum_divisors(b) == a
 3  end

About to run: return false
This means that sum_divisors(220) != 284. We probably want to jump to the sum_divisors(220) call.
We can always jump out of the debugging session with q and then we can start over 😄 So start with @enter is_amicable(220, 284) again and use s for step into the function.
1|debug> s
In sum_divisors(a) at /Users/olek/Code/opensources/blog/2020-10-27-basics-debugging/amicable.jl:5
  5  function sum_divisors(a)
> 6      result = 0
  7      for i = 1:a
  8          if a % i == 0
  9              result += i
 10          end

About to run: 0
1|debug>
Then we can continue with n but you can probably imagine that it takes a while.
What other tools do we have to check what is happening?
Some of you might think: Okay we should at least find out what we return, right and we can just call sum_divisors(220). That's probably the right thing to do but doesn't show the features of the Debugger. Let's imagine we only have access to the Debugger mode and can't just call the function.
In general this mode of learning new things by hiding what we already know is quite effective.
I think it's a good time to introduce the power of breakpoints.
Instead of following the program line by line it's often reasonable to jump to a particular point by running the code until that point is reached.
You can do this via bp add and then specifying the file, line number and possible condition. You can see all the options with ? inside the debug mode.
We are interested in bp add 12. Afterwards we can use the c command which stands for continue (until breakpoint).
1|debug> c
Hit breakpoint:
In sum_divisors(a) at /Users/olek/Code/opensources/blog/2020-10-27-basics-debugging/amicable.jl:5
  8          if a % i == 0
  9              result += i
 10          end
 11      end
>12      return result
 13  end

About to run: return 504
Okay we now know that it returns 504 instead of 284. We can now use ` to go into the julia mode. (I know it's kinda forbidden by our rules but it makes sense from time to time and we can see that we are in 1|julia> and not julia> so I think we're fine...)
\(504-284\) is not the hardest of calculation but we can use julia to do that for us without leaving the debug mode completely by using:
1|debug> `
1|julia> 504-284
220
Seems like we found our issue. We are adding the number itself to the result but it's not a real factor.
Which means we can do:
function sum_divisors(a)
     result = 0
-    for i = 1:a
+    for i = 1:a-1
         if a % i == 0
             result += i
         end
     end
     return result
 end
to avoid the problem.
We can get out of the evaluation mode with backspace and then q to quit the debug mode. Run
julia> is_amicable(220, 284)
true
and see that we fixed this bug.
Let's run it one last time in the debug session and have a look at watch variables.
Let's jump to the breakpoint again with c and run
1|debug> w add i
1] i: 219

1|debug> w add a
1] i: 219
2] a: 220
We now see the watch variables. If we click c again we jump to the break point again (for the second evaluation sum_divisors(284) == 220). We can use w again to see the watch list:
1|debug> w
1] i: 283
2] a: 284
There are more ways to play around i.e stepping in the code, show the lowered code and more. This should be good enough for an introduction. In the next section I want to give you the same example by using the visual studio code editor with the julialang extension.
Using VSCode
I think most of the Julia developers use the VSCode IDE and at least sometimes, when writing it in vim, emacs or whatnot is too hard... Okay it's probably just too inconvenient for me 😄
It's definitely time to switch to VSCode from Atom/Juno though as the Julia extension is now developed for VSCode instead of Atom.
As it's an IDE it makes sense to have a more visual debugger than the one described in the previous section.
It's pretty simple to navigate and you get more output by default.
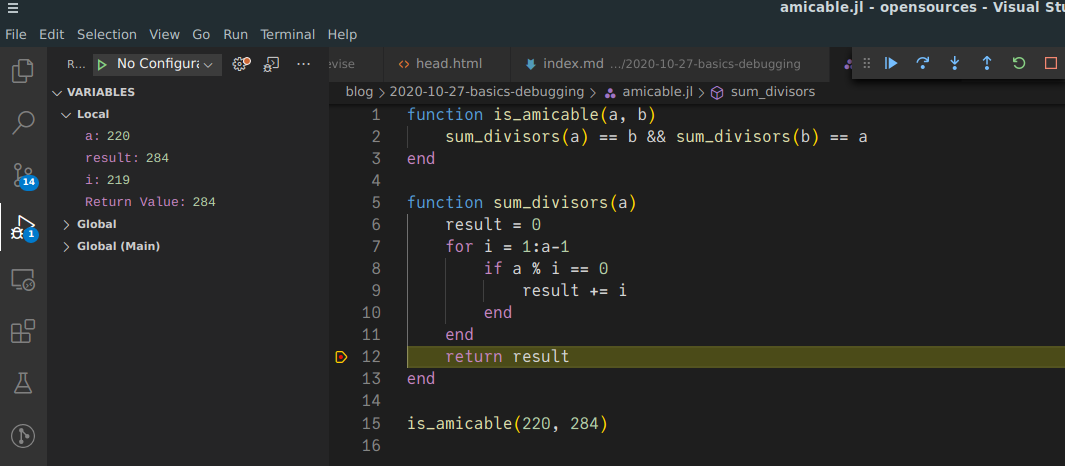
To start the debug session you click on button with the bug and play sign on the left while you have your julia file open. I've added the last line is_amicable(220, 284) as VSCode simply starts the program.
You can add the breakpoint by clicking to the left of each line number.
I took the screenshot after I did those steps with the last step being clicking on the debug button.
After a few seconds the debugging session is paused as the breakpoint is reached. On the left hand side one can then see the local variables at that position. This is the stage after I fixed the bug so you can see that the correct result 284 is returned. You also get the value for a and i though.
This is what we did before with our watch variables but there we had to manually add them.
Now we can manually add watch expressions as well. This can be done in the Watch part below Variables which is outside the screenshot. It's quite nice to be able to add breakpoints with a single click as well as having the local variables shown on the left by default.
You might ask yourself: Well these aren't really two ways of debugging, right? It's kinda the same way just with a different GUI.
True! That's why I come to the next section of the post now 😉
Infiltrator.jl for speed
There is one huge problem with the Julia debugger which is solved in different ways by a variety of packages. The problem is that the debugger is running in interpreted mode which makes it very slow. If you have debugged C++ code you know that the debugger is slower than execution there as well but for Julia it's like a huge problem in my opinion.
It's possible to go into compiled mode with the Debugger but that is experimental and at least for me it never stopped at a breakpoint.
Some other packages try to fix this issue by doing some fancy magic but I'm personally a huge fan of Infiltrator.jl. There hasn't been an update for a while though and I have some problems with it but I enjoy the idea.
It's also one of those projects with less than 100 stars. I want to push it over that milestone so if you like what you see in this section please head over and star the project. 😉
Infiltrator.jl takes a completely different route. First of all you have to change your code a bit to make it work. It provides a macro @infiltrate. Oh man I love that name 😄
The macro is kinda the same as a breakpoint from before. Whenever the line is reached a new kind of REPL mode is opened. This makes it a bit harder to switch between debug mode and normal run mode as you need to add or remove the @infiltrate macros but I think that's okay.
I'll again demonstrate this on the example above but normally you use it for bigger use cases where Debugger.jl is simply too slow. I described it a bit in this post on debugging ConstraintSolver.jl.
I've copied the code from above and just added using Infiltrator and @infiltrate.
using Infiltrator

function is_amicable(a, b)
    sum_divisors(a) == b && sum_divisors(b) == a
end

function sum_divisors(a)
    result = 0
    for i = 1:a-1
        if a % i == 0
            result += i
        end
    end
    @infiltrate
    return result
end

is_amicable(220, 284)
When running the code with include("amicable.jl") one now gets:
Hit `@infiltrate` in sum_divisors(::Int64) at amicable.jl:14:

infil>
This means we know which breakpoint got hit and see the type of the variable we called sum_divisors with. In contrast to Debugger.jl we don't see the code though.
It's possible to see the help section again using ?
infil> ?
  Code entered is evaluated in the current functions module. Note that you cannot change local
  variables, but can assign to globals in a permanent store module.

  The following commands are special cased:
    - `?`: Print this help text.
    - `@trace`: Print the current stack trace.
    - `@locals`: Print local variables.
    - `@exfiltrate`: Save all local variables into the store.
    - `@toggle`: Toggle infiltrating at this `@infiltrate` spot (clear all with `Infiltrator.clear_disabled!()`).
    - `@continue`: Continue to the next infiltration point or exit (shortcut: Ctrl-D).
    - `@exit`: Stop infiltrating for the remainder of this session and exit (on Julia versions prior to
      1.5 this needs to be manually cleared with `Infiltrator.end_session!()`).
There aren't that many commands so we can just try them out one by one. We started with ? so let's check the next one
infil> @trace
[1] sum_divisors(a::Int64) at amicable.jl:14
[2] is_amicable(a::Int64, b::Int64) at amicable.jl:4
[3] top-level scope at amicable.jl:18
[4] eval at boot.jl:360 [inlined]
[5] include_string(mapexpr::typeof(identity), mod::Module, code::String, filename::String) at loading.jl:1094
[6] _include(mapexpr::Function, mod::Module, _path::String) at loading.jl:1148
[7] include(fname::String) at client.jl:444
[8] top-level scope at REPL[2]:1
So we came from is_amicable and can see the types as well as the filename and linenumber which is helpful when you used multiple dispatch.
infil> @locals
- result::Int64 = 284
- a::Int64 = 220
we can see the local variables which is similar to the ones we saw in the VSCode Variables view.
New in v1.0 of Infiltrator:
In the new version there is a way to save locals in a new variable called safehouse. This can be done with @exfiltrate:
infil> @exfiltrate
Exfiltrating 2 local variables into the store.
This means that the safehouse variable now has two variables stored which can be accessed with
infil> safehouse.<TAB>
a      result
Additionally we can simply write expressions in this mode that get evaluated. For Infiltrator.jl it's not necessary to use ` to switch to that mode.
debug> a == 220
true
You can use @toggle to not stop infiltrating at the current "breakpoint" or toggle it back on. Infiltrator.clear_disabled!() can be used to clear this @toggle decisions.
Let's not use @toggle now though and instead jump to the next @infiltrate point by using CTRL-D.
Now we see:
Hit `@infiltrate` in sum_divisors(::Int64) at amicable.jl:14:

infil>
so we are at the same breakpoint but with the second call. Fortunately as of v1.0 it's now possible to use the arrow up key to jump through the history of commands which we used.
Let's have a look at a comparison of the two different ways in the next section.
Conclusion
We had a look at Debugger.jl which gives you all the information you can possibly need in your REPL. It's therefore independent of your editor.
The next tool I mentioned was to use the build in debug view of VSCode which is basically just a GUI for Debugger.jl. It is probably more convenient to use for people who like to work with the IDE. There might be some options in Debugger.jl though that aren't available in the GUI though as it is often the case.
Both of those tools have the advantage that you can jump step by step through your code and investigate whatever you want. You can have a look at the lowered code (at least in Debugger.jl). It's probably what everyone expects to do with a debugger. The problem is simply that it is too slow in a lot of use cases like when you want to debug your own package with 1000s of lines of code.
In that case Infiltrator.jl is the way to go at least for me and for now as long as the compiled mode of Debugger.jl doesn't work good enough. It has some other drawbacks as there is no free lunch but I think it's often superior to using println as one can print whatever one is currently interested at a given breakpoint and can see all the local variables in one go.
The next post is about profiling your code once it is bugfree (more or less at least 😉).
Thanks for reading and special thanks to my 10 patrons!
Special thanks to my >4$ patrons. The ones I thought couldn't be found 😄
Site Wang
Gurvesh Sanghera
Szymon Bęczkowski
DShiu
For a donation of a single dollar per month you get early access to these posts. Your support will increase the time I can spend on working on this blog.
There is also a special tier if you want to get some help for your own project. You can checkout my mentoring post if you're interested in that and feel free to write me an E-mail if you're interested: o.kroeger <at> opensourc.es
I'll keep you updated on Twitter OpenSourcES.
Want to be updated? Consider subscribing on Patreon for free