How to profile julia code?
Creation date: 2019-11-09
This is kind of part 13 of the series about: How to build a Constraint Programming solver? But it is also interesting for you if you don't care about constraint programming. It's just about: How to make your code faster.
Anyway these are the other posts so far in the ongoing series:
In the last post the benchmark looked good for classic sudokus but not so much for killer sudokus and okayish for graph coloring I would say. As always one can try to improve the performance by rethinking the code but today I mostly want to share how one can check which parts of the code are slow and maybe improve on that i.e by reducing the memory consumption.
First step in improving the performance is always to know what is slow at the moment. We don't want to take hours in improving one line of code which is only responsible for 1% of the code run time.
An important step is to reduce the memory used.
Memory usage
Let's find out how much memory we use in the the normal sudoku case at first because we call less functions there:
> julia
julia> using Revise
julia> include("benchmark/sudoku/cs.jl")
julia> main()
julia> @time main(;benchmark=true)
quite a normal setup. The first main() call is for compiling and checking that we solve every sudoku. The @time macro gives us the time but also the memory usage.
1.009810 seconds (3.69 M allocations: 478.797 MiB, 18.51% gc time)Attention: This includes all kind of timing not just the solve and is run on my Laptop so don't compare that to the benchmark results from last time.
We use ~500MiB of memory for solving 95 sudokus. Aha and now? Yeah that doesn't give us much detail. Therefore we make memory measurements per line now. Close the current session first.
> julia --track-allocation=user
julia> include("benchmark/sudoku/cs.jl")
julia> main(;benchmark=true)
Close the session.
In the file explorer of your IDE you can now see a couple of *.mem files. I suppose the most memory is used in the constraint all_different.jl
i.e at the bottom of the file you see:
- function all_different(com::CoM, constraint::Constraint, value::Int, index::Int)
 12140913     indices = filter(i->i!=index, constraint.indices)
  7885120     return !any(v->issetto(v,value), com.search_space[indices])
           - end
7885120 means that ~7.5MiB are used in that line. (This is a cumulative measurement).
The function itself checks whether we can set value at index or whether that isn't possible (violates the constraint).
We do a filtering step first here which is creates a new array in the first line and for the second line we again create an array and fill it with true or false and then iterate over it to check if any of them is true. This is a short form but quite wasteful.
It can be replaced by:
indices = constraint.indices
for i=1:length(indices)
    if indices[i] == index
        continue
    end
    if issetto(com.search_space[indices[i]], value)
        return false
    end
end
return true
We don't have any memory consumption afterwards.
In line 67 we have:
6393440     pval_mapping = zeros(Int, length(pvals))
 24295072     vertex_mapping = Dict{Int,Int64}()
  8950816     vertex_mapping_bw = Vector{Union{CartesianIndex,Int}}(undef, length(indices)+length(pvals))
In general it is a good idea to avoid dictionaries if possible. Here the keys are the possible values and the values is a mapping which in used in the backwards direction as well: vertex_mapping_bw.
Normally our variables will have a range like 1:9 so we could directly replace it by a vector but we also have -9:-1 for example.
We can use:
min_pvals, max_pvals = extrema(pvals)
len_range = max_pvals-min_pvals+1
min_pvals_m1 = min_pvals-1
vertex_mapping = zeros(Int, len_range)
and then for accessing the value:
vertex_mapping[value(search_space[i])-min_pvals_m1]-length(indices)instead of
vertex_mapping[value(search_space[i])]-length(indices)Additionally I realized that we don't use CartesianIndex anymore so we don't need the Union part in vertex_mapping_bw.
Specific to the constraint solver: We used edges and directed edges before but we don't need the edges after the directed edges and we have the same amount so we can use the same array structure and just override the memory instead of allocating new memory.
In general one goes along those *.mem files and checks whether the memory can be reduced. It is probably quite specific for each program how this can be done but now you know how to measure it.
How about run time profiling instead of memory?
Run time profiling
This is harder I would say both technically and therefore also for us. In general the execution gets interrupted for this process and the stack gets analysed to obtain the necessary information but I don't want to explain that in too much detail here as I don't know too much about it and I don't think it's too important. (A bit knowledge is good though.)
There is the standard julia profiler which produces output like this:
julia> Profile.print()
80 ./event.jl:73; (::Base.REPL.##1#2{Base.REPL.REPLBackend})()
 80 ./REPL.jl:97; macro expansion
  80 ./REPL.jl:66; eval_user_input(::Any, ::Base.REPL.REPLBackend)
   80 ./boot.jl:235; eval(::Module, ::Any)
    80 ./<missing>:?; anonymous
     80 ./profile.jl:23; macro expansion
      52 ./REPL[1]:2; myfunc()
       38 ./random.jl:431; rand!(::MersenneTwister, ::Array{Float64,3}, ::Int64, ::Type{B...
        38 ./dSFMT.jl:84; dsfmt_fill_array_close_open!(::Base.dSFMT.DSFMT_state, ::Ptr{F...
       14 ./random.jl:278; rand
        14 ./random.jl:277; rand
         14 ./random.jl:366; rand
          14 ./random.jl:369; rand
      28 ./REPL[1]:3; myfunc()
       28 ./reduce.jl:270; _mapreduce(::Base.#identity, ::Base.#scalarmax, ::IndexLinear,...
        3  ./reduce.jl:426; mapreduce_impl(::Base.#identity, ::Base.#scalarmax, ::Array{F...
        25 ./reduce.jl:428; mapreduce_impl(::Base.#identity, ::Base.#scalarmax, ::Array{F...
You can read more about it in the official documentation but I'm not a huge fan of that. It's hard to read and feels more like a format for computers than for human beings.
The second option is to use the Juno profiler which is integrated into Juno the julia extension for the Atom editor.
It produces visually appealing output

but sometimes it is not enough output for me and one might be able to change that but changing the interrupt frequency.
I asked in the Julia slack community and got referred to the PProf.jl package which I want to explain a little bit more here.
It takes the computer readable format from above and visualizes it in different ways. More specific: PProf is the new format it gets converted to and there are tools which visualize that. It is also used for other programming languages. Most content I found was for the programming language Go.
After installing it with ] add PProf and graphviz you can run:
> julia
julia> using Revise, Profile, PProf
julia> include("benchmark/sudoku/cs.jl")
julia> main()
julia> @profile main(;benchmark=true)
julia> pprof(;webport=58599)
run julia> Profile.clear() if you want to profile something else afterwards.
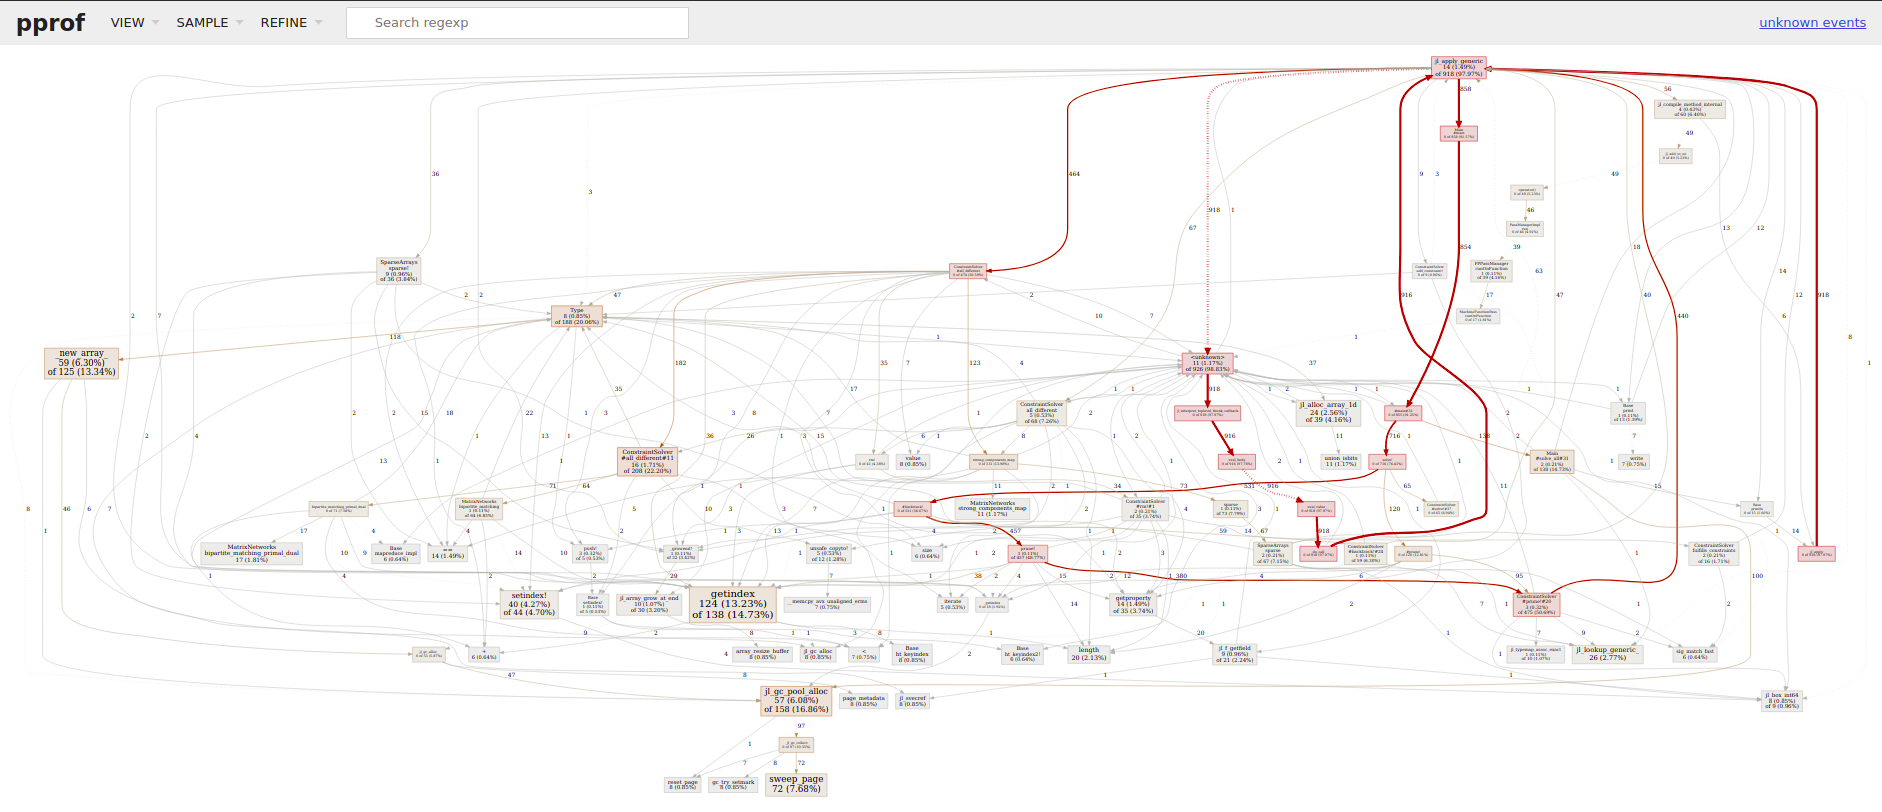
Then you can click on the link to localhost:58599 and get:

I don't know about you but I don't get too much information out of it. The arrows a -> b are a calls b and the numbers provide run time information. (In Go this is actual timing in ms, s) here it is the number of operations as far as I understand it.
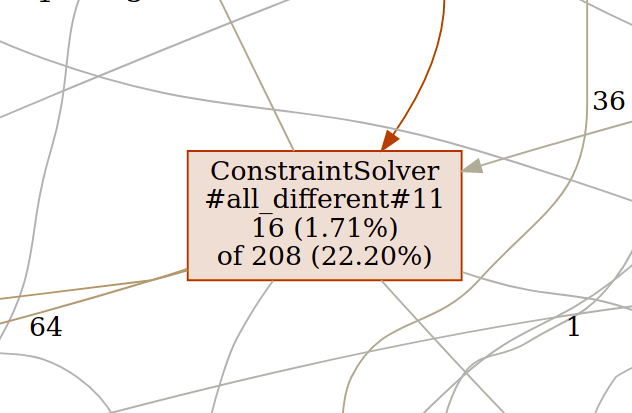
Zooming in:

The all_different function is accountable for 22% of the all run time but only 1.7% itself meaning it calls functions which are actually consuming the time i.e the bipartite_matching function and strong_components_map.
But there are other visual representations which I find more useful.
Attention These screenshots are from the current master branch and not after the memory improvements.
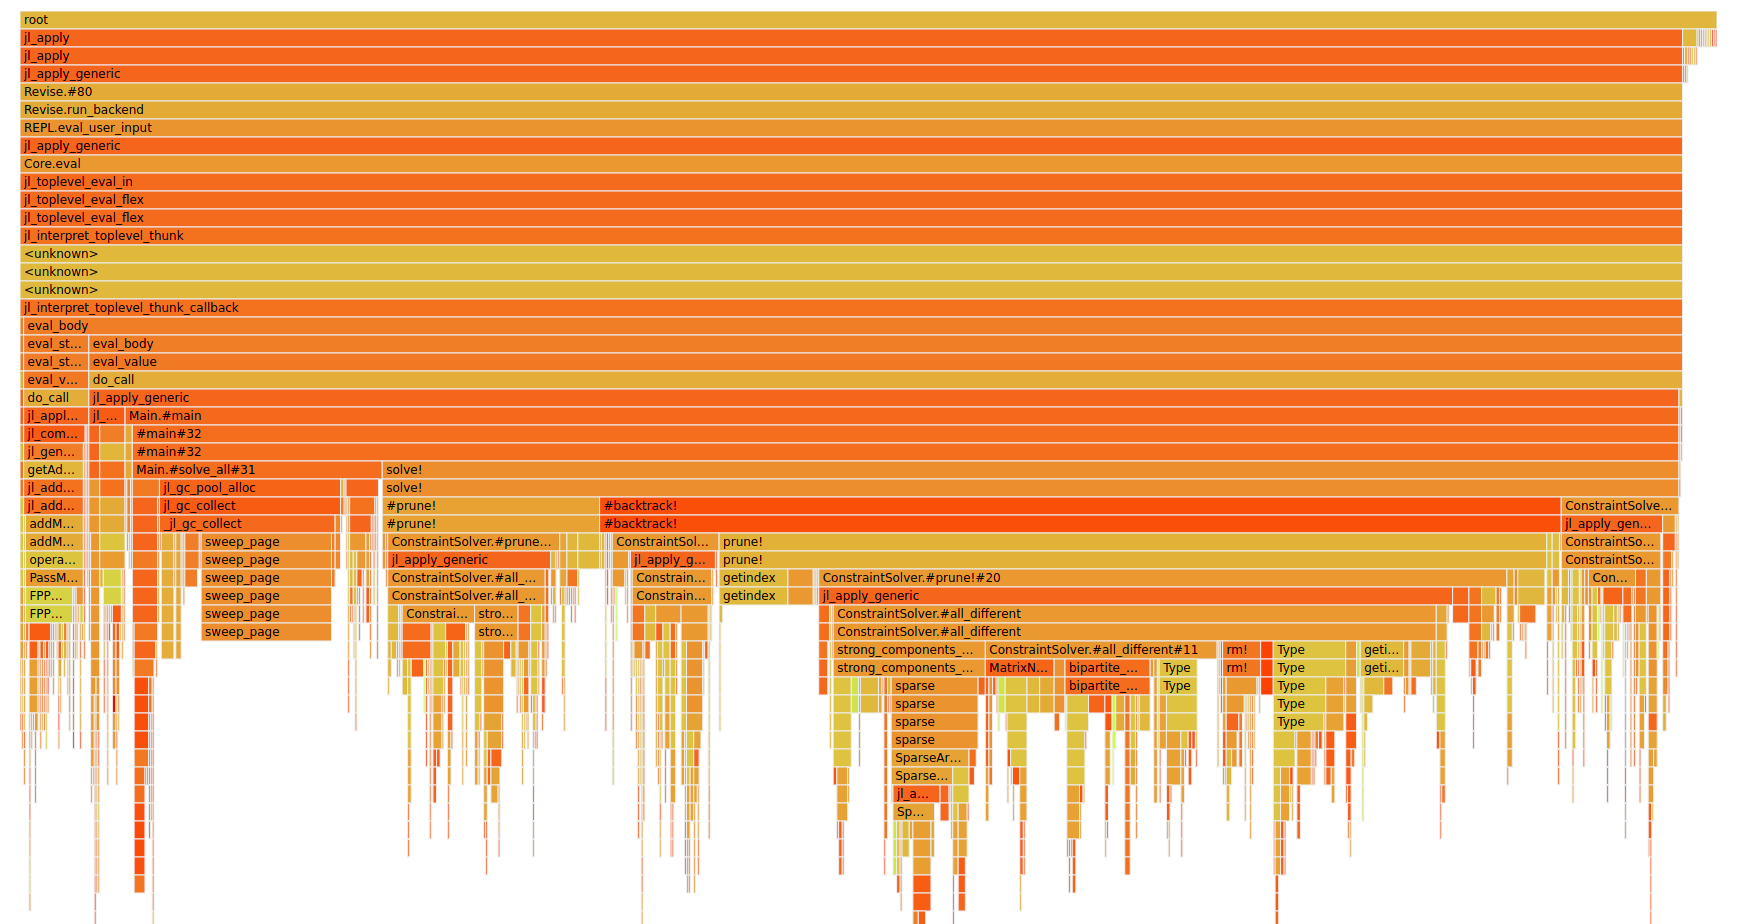
You can change the representation with View-> next up is Flame Graph.

Some important things about flame graphs:
There is no meaning for the x axis in general
One might assumes that this is the sweep over time but it's not :)
The length in x direction does show the time
But it is sorted such that the
all_differentcalls for example are combined into one block instead of 100s
The y axis shows the stack depth
The color is random or well it has no meaning (it is just used to easily differentiate between two blocks)
We are only interested in the solve part as we currently still look at solving 95 sudokus. We could reduce that to solving only 1 but I think we get a better view this way as we have more data.
Clicking on the solve! block gives us:

If you hover over solve! you can see that it takes 76% of the complete run time. One can clearly see that the all_different constraint takes the most time (I mean the one under prune!).
Backtrack used 57% of the whole time so 75% of solve! and prune! takes a bit less than 86% of the whole backtrack! time as we also have some all_different calls before prune!.
 It is quite obvious that there are three big components:
strong_components_mapTypebipartite_matching&bipartite_matching_primal_dual
As mentioned before this is before our memory improvements. Let's have a look at after:

You can see that it removed some of the Type blocks and reduced others.
Now there is one problem with the bipartite_matching calls: Normally I would say if you call another library it's the job of someone else :D in this case the library actually solves a harder problem which I didn't realize that much before.
Our goal is to find a maximum cardinality matching which means we want to find a matching between variables and values such that all variables get exactly one value. If this can't be achieved it is infeasible. The library uses also weights of the edges and tries to find the maximum sum of the edges inside the matching. I've set the weights to 1 and thought: Well that solves my problem but the runtime is worse and it uses more memory.
Therefore in the next post I'll implement a maximum cardinality matching algorithm and make a PR for that in the MatrixNetworks.jl package.
Some other points
Constraint ordering
I've mentioned that I think the order of calling the constraints might be important. The current approach was to just call them one by one. Level by level to be more precise so all that changed and then all that changed because the ones before changed something and so on until no further pruning was possible.
New idea: Count how many open values each constraint has and take the constraint first which has the least open values as this might be an easy fix.
I'll show you some new benchmarking results in the next post.
Bug
The main reason why I didn't blog last week was because of a weird bug I wasn't able to find. The constraint solver wasn't deterministic anymore and that is a huge deal because if it isn't it's harder to debug and if someone finds an error which only occurs every fifth time it's just bad and unpredictable. Even worse is if you think it should be deterministic than there is probably a real bug.
It took me 3 days to find out that the bug that only happened about 5% of the time on my local machine was that I had a boolean variable in_all_different which is useful for the eq_sum constraint and I asked if !in_all_different check whether it actually is in a all_different constraint but I didn't initialize the boolean variable anywhere so it was "randomly" true or false depending on what was set at that memory before I started the program.
I've also added some test cases for this by logging the trace and comparing it for two different runs of the same problem.
Hopefully I'll realize a bug like this earlier now if something like that appears again.
Kaggle challenge
As of now the Kaggle challenge Santa 2019 didn't start yet. Once it does I'll have a look at it and blog about it as soon as possible. Explaining the problem first and some ideas probably and work on it the next weeks then and keep you posted as this time I'll not go for winning a medal but instead gaining some followers for the blog from the Kaggle community ;)
What's next?
There are some things missing:
Bipartite matching
Trying to speed up the sum constraint
Only one bit takes a bit memory which maybe can be reduced
Looking at the search tree for bigger graph coloring
Stay tuned ;)
Next post is available Bipartite matchings.
And as always:
Thanks for reading and special thanks to three patrons!
List of patrons paying more than 2$ per month:
Site Wang
Gurvesh Sanghera
Currently I get 9$ per Month using Patreon and PayPal when I reach my next goal of 50$ per month I'll create a faster blog which will also have a better layout:
Code which I refer to on the side
Code diffs for changes
Easier navigation with Series like Simplex and Constraint Programming
instead of having X constraint programming posts on the home page
And more
If you have ideas => Please contact me!
If you want to support me and this blog please consider a donation via Patreon or via GitHub to keep this project running.
For a donation of a single dollar per month you get early access to the posts. Try it out for the last two weeks of October for free and if you don't enjoy it just cancel your subscription.
If you have any questions, comments or improvements on the way I code or write please comment here and or write me a mail o.kroeger@opensourc.es and for code feel free to open a PR on GitHub ConstraintSolver.jl
I'll keep you updated on Twitter OpenSourcES as well as my more personal one: Twitter Wikunia_de
Want to be updated? Consider subscribing on Patreon for free


