COVID-19 Visualization
Creation date: 2020-03-06

This is a special blog post but after having a major decision about how to compute bounds yesterday for the ConstraintSolver I promise the next post will be one about the ConstraintSolver again.
Based on the recent events I wanted to create a visualization about the COVID-19 virus to play around with the publicly available data a little bit. I'm a huge fan of data visualization especially on maps.
First of all we need to get the data and then I want to visualize the number of total cases over time. It can be easily modified to only show active cases or what I'm also interested in is the number of cases per 100,000 people. I'm planning on updating the visualization at the end of the post regularly when new data arrives.
Getting the data
Most people probably look at this map to check the current status but I'm not a huge fan of the circles and wanted to create an actual overlay over the country as it's quite easy to get the shapefiles of the countries but the ones of the provinces will take more time/effort :D
They use the data from this repo which I also use.
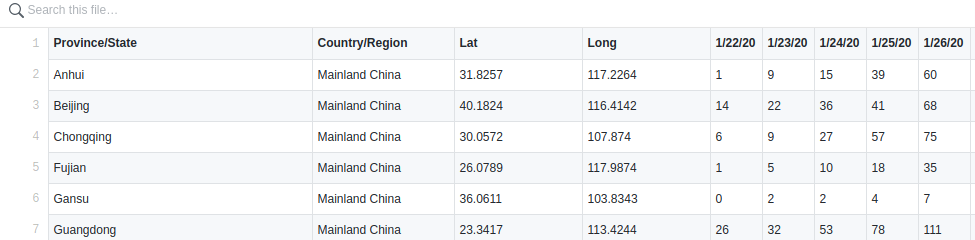
The first step after downloading the data:
download("https://raw.githubusercontent.com/CSSEGISandData/COVID-19/master/csse_covid_19_data/csse_covid_19_time_series/time_series_19-covid-Confirmed.csv", "covid.csv")is to combine all cases from Mainland China into one row and the same for all other countries of course.
The first step is to remove some columns we don't need and a simple renaming of the Country/Region column.
using DataFrames, CSV
function summarize_data()
    df = CSV.read("covid.csv"; copycols=true)
    select!(df, Not(Symbol("Province/State")))
    select!(df, Not(:Lat))
    select!(df, Not(:Long))
    rename!(df, Symbol("Country/Region") => :Country)
end
Later I also don't have a shapefile for some countries one of them is Hong Kong which I count as China here. Hopefully that's okay for this visualization...
for row in eachrow(df)
    if row[:Country] == "Hong Kong"
        row[:Country] = "Mainland China"
    end
end
Next step is to sum up the cases grouped by :Country which can be done using:
adf = aggregate(df, :Country, sum)I also renamed some country names to work with the shapefiles later and renamed the dates to my preferred format :D
dates = names(adf)[2:end]
for date in dates
    col_name = string(date)[1:end-4]
    parts = split(col_name, "/")
    col_name = "$(parts[2]).$(parts[1]).$(parts[3])"
    rename!(adf, date => Symbol(col_name))
end
for row in eachrow(adf)
    if row[:Country] == "Mainland China"
        row[:Country] = "China"
    elseif row[:Country] == "US"
        row[:Country] = "United States"
    elseif row[:Country] == "UK"
        row[:Country] = "United Kingdom"
    end
end
CSV.write("summarized.csv", adf)
Now we have a csv file with a column for each date and the number of cases for that date per country.
Visualization
I'm using another Julia plotting library after using Plots.jl and tried out Makie.jl for others. This time I use Luxor.jl as they have an example of a world map ;)
Let's include all libraries we need first
using Shapefile, Luxor
using DataFrames, CSV
using ColorSchemes
using Dates

include(joinpath(dirname(pathof(Luxor)), "readshapefiles.jl"))
I'm not a huge fan of the include() but that's what was used in the documentation of Luxor so maybe there is no better way currently.
Then we need to get the shapefiles for each country which I got from arcgis. It's a zip file where I obtain a Countries_WGS84.shp file with all shapefiles of each country and a .dbf file or something which I changed into a .csv file to have a mapping from country to shapefile.
worldshapefile = "shapefiles/Countries_WGS84.shp"
countries = CSV.read("shapefiles/Countries_WGS84.csv")
corona_data = CSV.read("summarized.csv")
countries_dict = Dict{String, Int}()
for row in eachrow(countries)
    countries_dict[row[:country]] = row[:id]
end

worldshapes = open(worldshapefile) do f
    read(f, Shapefile.Handle)
end

date = Symbol("22.1.20")
draw_corona_map("images/corona-map.png", worldshapes, countries_dict, corona_data, date)
That loads all necessary files and I load the Countries_WGS84.csv as a dict to map from country name to index in the shapefile.
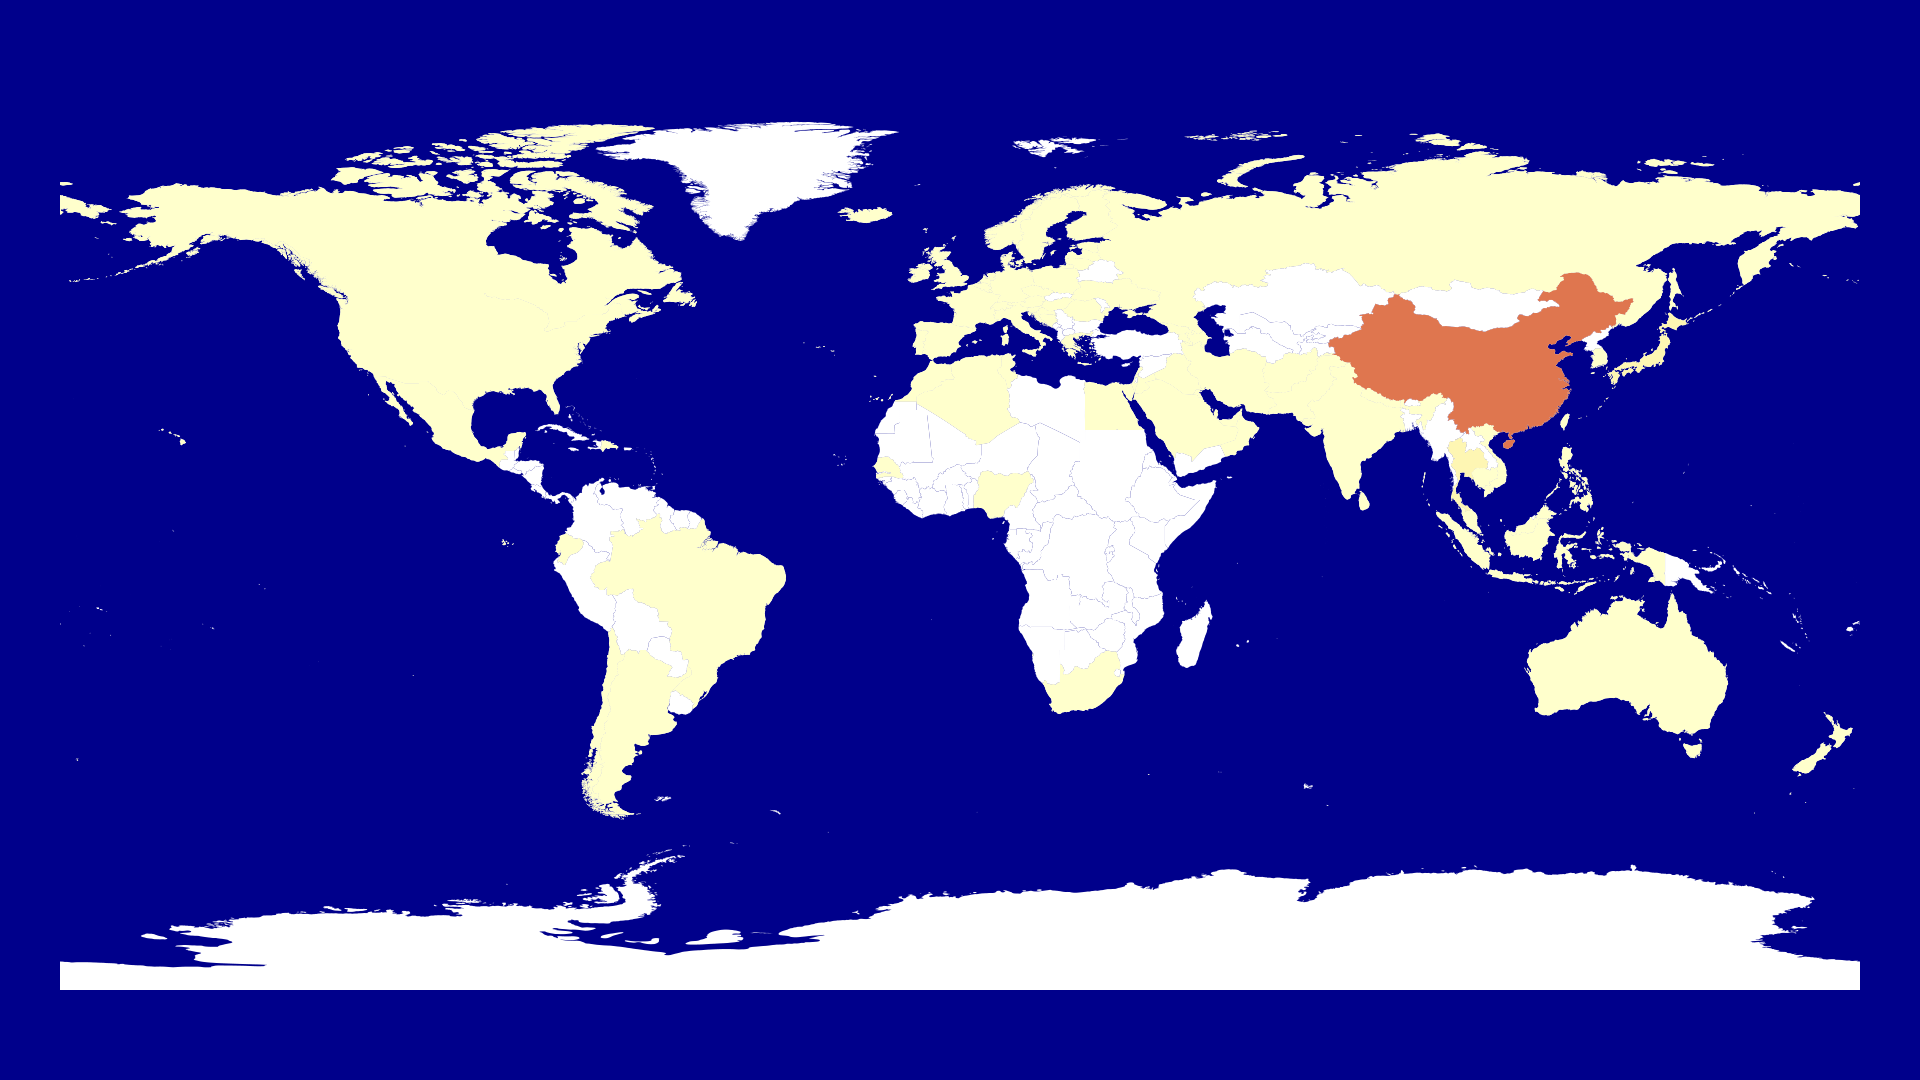
Let's draw a map of the world first:
function draw_corona_map(outputfilename, countryoutlines, countries, corona_data, date)
    Drawing(1920, 1080, outputfilename)
    background("darkblue")
    origin()
    scale(5, 5)

    setcolor("white")
    for country in countries
        pgons, bbox = convert(Array{Luxor.Point, 1}, countryoutlines.shapes[country.second])
        for pgon in pgons
            poly(pgon, :fill)
        end
    end

    finish()
end
First we need to create a Drawing then we set the origin as the middle of the drawing which works perfectly for a world map with latitude/longitude coordinates.
The next step is to scale the map here I chose 5 for x and y. We have a width of 1920 and the longitude ranges from -180 to 180. 360*5 = 1800 so we have a bit of space left and right.
We set the color of our polygons to white and then iterate over every country and draw the country lines.

Now we want to visualize the corona cases on the 22nd of January.
Therefore we include:
for row in eachrow(corona_data)
    country = row[:Country]
    cases = row[date]
    if haskey(countries, country)
        id = countries[country]
        color = get(colorschemes[:lajolla], log10(cases), (0.0, 5.5))
        setcolor((color.r,color.g,color.b))
        pgons, bbox = convert(Array{Luxor.Point, 1}, countryoutlines.shapes[id])
        for pgon in pgons
            poly(pgon, :fill)
        end
    end
end
before calling finish(). We need to check whether the country listed in our summarize.csv which is now in corona_data lists a country which has a shapefile. This isn't the case for all but for almost all so we are fine. This is the point where I realized to change US to United States in when writing the summarize.csv.
If the shapefile exists we get the id of the shapefile and a color. Here I use ColorSchemes as in the Mandelbrot video. I also decided to use the logarithm to get a color as otherwise China is the only country which we see on the map and all other countries seem to be case free.
The next step is to create such a map for each date we have. Therefore we create a start_date and use the Dates library to get all dates up to the last day in the file. We get the number of dates with ncol(corona_data)-1 as the other column is :Country.
start_date = Date(2020,01,22)
dates = Vector{Symbol}(undef, ncol(corona_data)-1)
for i=0:ncol(corona_data)-2
    new_date = start_date + Dates.Day(i)
    dates[i+1] = Symbol(Dates.format(new_date, "d.m.yy"))
end
t = 0
for date in dates
    fname_pad = lpad(t, 3, "0")
    draw_corona_map("images/corona-map-$fname_pad.png", worldshapes, countries_dict, corona_data, date)
    t += 1
end
The lpad function pads the counter with zeros which makes it easier to order the images and create a mp4 out of it.
Additionally I created a legend and a title etc to obtain:
Confirmed cases til 7th of March
Active cases til 7th of March
This shows the number of active cases so confirmed-deaths-recovered.
I will also create visualizations based on country size and population density. Additionally I'll try to make a website for it such that people can zoom in and maybe find shapefiles of provinces and states to have a more detailed visualization.
Hope you enjoyed this post!
Thanks for reading and special thanks to my five patrons!
List of patrons paying more than 4$ per month:
Site Wang
Gurvesh Sanghera
Szymon Bęczkowski
Currently I get 18$ per Month using Patreon and PayPal.
For a donation of a single dollar per month you get early access to the posts. Try it out at the start of a month and if you don't enjoy it just cancel your subscription before pay day (end of month).
I'll keep you updated on Twitter OpenSourcES as well as my more personal one: Twitter Wikunia_de
Want to be updated? Consider subscribing on Patreon for free