CSV2HTML data filtering, sorting
Creation date: 2019-03-08

Yesterday I built a helpful tool for checking how a change in my code improves its performance or make it worse in some cases. For those of you who don't know what I'm currently working on: I'm currently implementing a Mixed Integer Non Linear Local Problem Solver called Juniper. The mathematical modelling language JuMP had a major change therefore all solvers which rely on it need(ed) to be upgraded. Whenever I change something in Juniper I run test cases and produce a csv file with my results:
./solvers/juniper/JuniperLibSm/crudeoil_li11.stdout:DATA, crudeoil_li11.jl, 1178, 180, 0, 192, MAX_SENSE, NaN, NaN, ITERATION_LIMIT, 370.96692395210266
./solvers/juniper/JuniperLibSm/nuclear49a.stdout:DATA, nuclear49a.jl, 3342, 2450, 0, 1332, MIN_SENSE, -1.1514935818933736, -1.1514873810196395, LOCALLY_SOLVED, 132.0416829586029
./solvers/juniper/JuniperLibSm/sfacloc2_4_80.stdout:DATA, sfacloc2_4_80.jl, 401, 122, 0, 60, MIN_SENSE, 11.294441967836995, 6.046980804778224, TIME_LIMIT, 3600.2915008068085
./solvers/juniper/JuniperLibSm/FLay06M.stdout:DATA, FLay06M.jl, 87, 60, 0, 6, MIN_SENSE, 66.9327939853019, 60.187551571674774, TIME_LIMIT, 3600.008817911148
now you can check everything in LibreOffice Calc or Excel to get something like this:
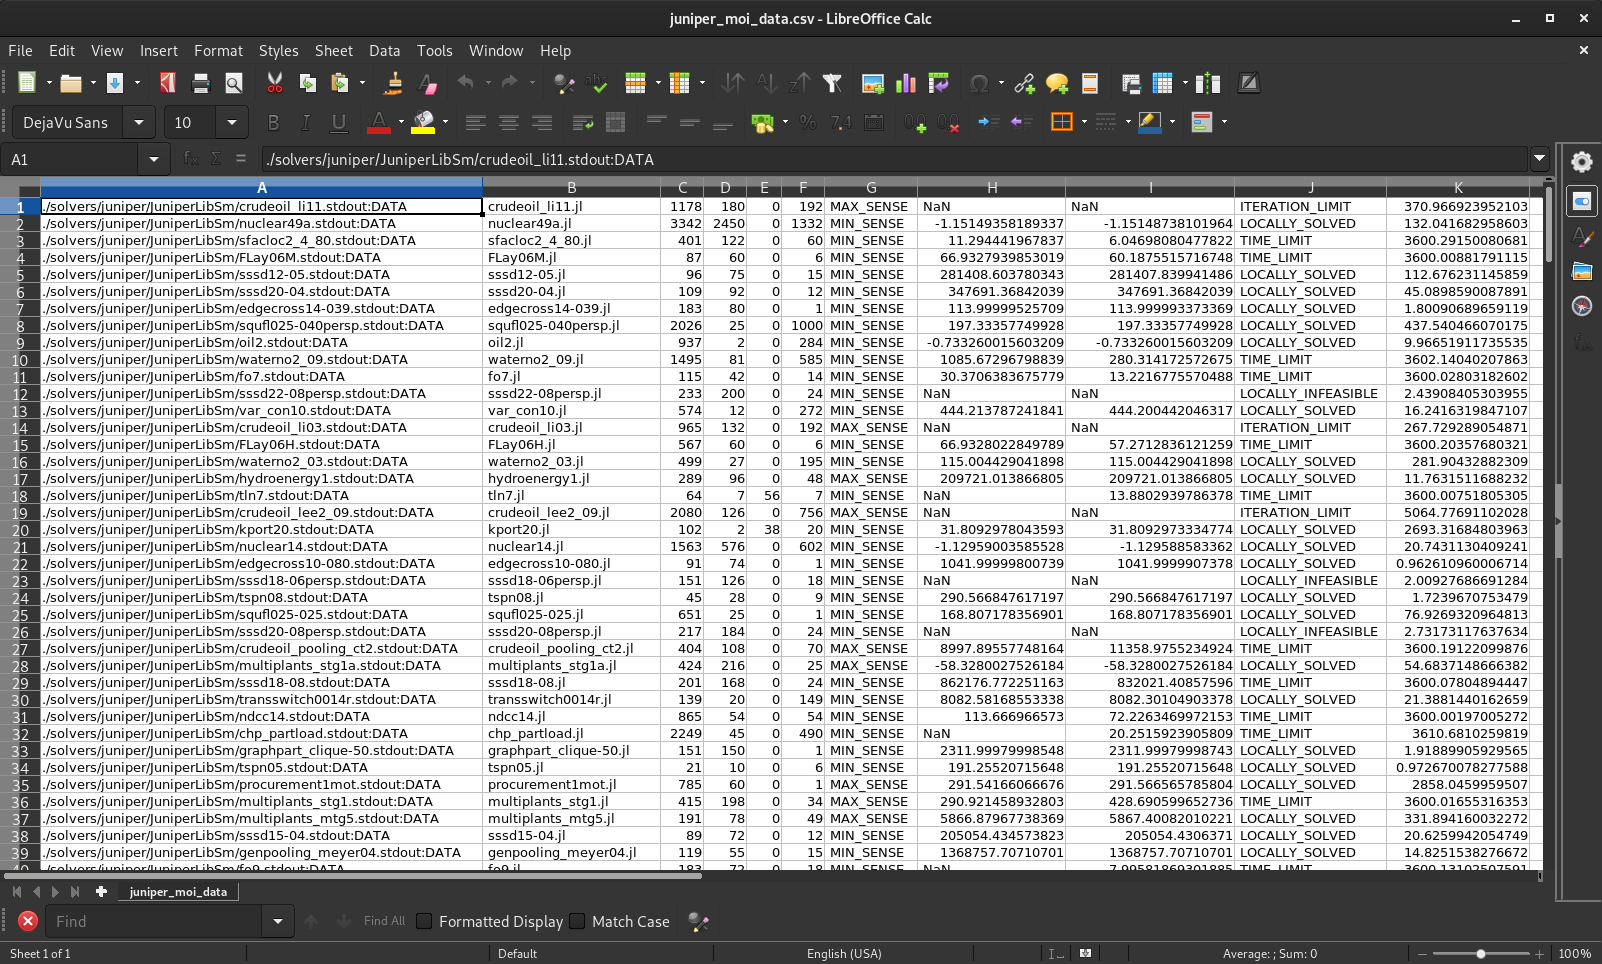
it's still not that helpful. Another problem is that you actually want to combine two of these csv files to actually compare your new version to a previous version.
That's why I build this
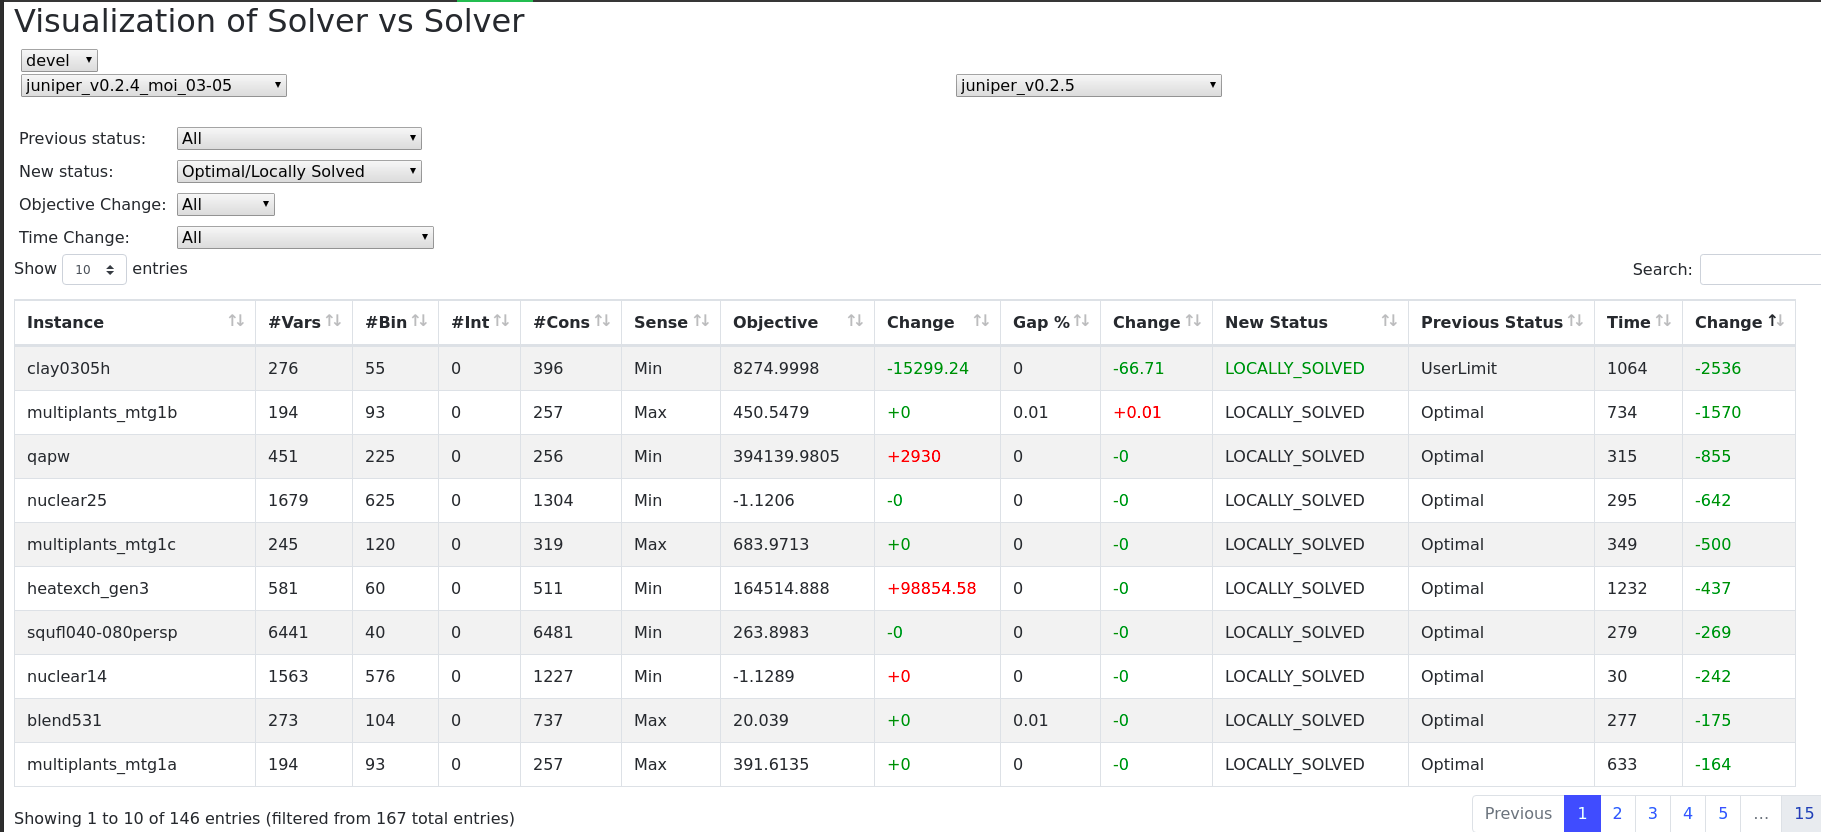
I did this using DataTables and d3.
You can have a full look at the code js/table.js in the repo. I'll just show some concepts here:
Reading data
Reading the csv file with d3.
function getData(file, path, headers, cb) {
    d3.text(path, function(error, data) {
        data = d3.csvParse(headers +"\n"+ data,d=>{
            return {
                instance: d.instance.substr(0,d.instance.length-3).trim(), // get rid of .jl
                nodes: +d.nodes,
                bin_vars: +d.bin_vars,
                int_vars: +d.int_vars,
                constraints: +d.constraints,
                sense: d.sense.trim(),
                objVal: precise(+d.objVal),
                best_bound: precise(+d.best_bound),
                gap: precise((Math.abs(+d.best_bound-(+d.objVal))/Math.abs(+d.objVal))*100.0,2),
                status: getRealStatus(d, file),
                time: precise(+d.time, 0)
            }
        });
        cb(data);
    });
}
file is the filename like juniper, path is the actual path to that file. headers is a string which has all the header information. (D3 wants this as your first row of your csv file so I use headers +"\n"+ data), adn we have a callback function. Reading the data as text and parse it combined with header as csv. Normally everything is a string so +d.nodes makes the nodes column to a number for example. I also compute another field gap here and round some columns.
When we have all our data we can create a html table with D3:
Create HTML Table
var container = d3.select("#specific_run_table")
    .append("thead")
    .selectAll("tr")
        .data([data[0]]).enter()
        .append("tr")

    .selectAll("th")
        .data(function(d) { return obj2Arr(d, keyOrder=keyOrder); }).enter()
        .append("th")
        .text(function(d) { return d; });


var inner = d3.select("#specific_run_table")
    .append("tbody")
    .selectAll("tr")
        .data(data.slice(1)).enter()
        .append("tr")

    .selectAll("td")
        .data(function(d) { return obj2Arr(d, keyOrder=keyOrder); }).enter()
        .append("td")
        .html(function(d) { return d; });
this creates a thead section for our first row (the header) and tbody for the actual data. The bottom part i.e reads as: Get the table by id add <tbody></tbody> and inside we create a couple of <tr></tr> which should contain the data (without header). then we add some <td></td> and in each tr we have access to one row of our data frame. This is currently an object but d3 needs an array so we convert it and we want the same order every time so first the name of the instance and in the end the time and so on. The function obj2Arr is quite simple for that. Then we have the correct amount of td (number of columns) and each holds a single value. Some might have a color and look like <span style="color:green">+123</span> that's why I used .html() here instead of text() which is sufficient normally.
and in our html document we have:
<table id="specific_run_table" class="table table-striped table-bordered" style="width:95%">

</table>
as well as some css and js for DataTables.
<script src="https://code.jquery.com/jquery-3.3.1.js"></script>
<script src="https://cdn.datatables.net/1.10.19/js/jquery.dataTables.min.js"></script>
<script src="https://cdn.datatables.net/1.10.19/js/dataTables.bootstrap4.min.js"></script>
and
<link rel="stylesheet" href="https://cdnjs.cloudflare.com/ajax/libs/twitter-bootstrap/4.1.3/css/bootstrap.css">
<link rel="stylesheet" href="https://cdn.datatables.net/1.10.19/css/dataTables.bootstrap4.min.css">
but you can just have a look at their website for that i.e in the examples section.
In the end we have to call $('#specific_run_table').DataTable(); to make it beautiful ;)
Some extras
DataTables has some nice features like sorting and filtering out of the box. Now sometimes it's nice to have some custom filters as well. In my example I want the instances which could be solved before but can't be anymore.
This can be done easily with a custom filter function explained here
If you enjoy the blog in general please consider a donation via Patreon. You can read my posts earlier than everyone else and keep this blog running.
Want to be updated? Consider subscribing on Patreon for free