Javis: Taxi Trip Visualization
Creation date: 2022-01-02

Happy new year everyone!
I'm finally back with another Javis post. Today I want to recreate and animate a visualization I've created a while back during a Kaggle competition. It's my favorite visualization and actually hangs behind me on my wall 😄
Anyhow, you can scroll to the end of the post if you want to see what we create or simply follow along for the more surprising route of reading this post.
What kind of data do we have?
I use the training dataset of taxi trip Kaggle computation. It contains a list of taxi trips with information like start time and a list of GPS coordinates that have been measured every 15 seconds.
To obtain the dataset you need to create a Kaggle account and accept some terms and conditions. Then you can download the dataset and unzip it.
Reading the dataset can be achieved with CSV.jl and DataFrames.jl and should be done only a single time as it's quite a big csv file (1.8GB).
using CSV
using DataFrames
trips = CSV.read("PATH/train.csv", DataFrame)
If you type that in the REPL you'll see the table like this:
1710670×9 DataFrame
     Row │ TRIP_ID              CALL_TYPE  ORIGIN_CALL  ORIGIN_STAND  TAXI_ID   TIMESTAMP   DAY_TYPE  MISSING_DATA  POLYLINE
         │ Int64                String1    Int64?       Int64?        Int64     Int64       String1   Bool          String
─────────┼────────────────────────────────────────────────────────────────────────────────────────────────────────────────────────────────────────────
       1 │ 1372636858620000589  C              missing       missing  20000589  1372636858  A                false  [[-8.618643,41.141412],[-8.61849…
       2 │ 1372637303620000596  B              missing             7  20000596  1372637303  A                false  [[-8.639847,41.159826],[-8.64035…
       3 │ 1372636951620000320  C              missing       missing  20000320  1372636951  A                false  [[-8.612964,41.140359],[-8.61337…
       4 │ 1372636854620000520  C              missing       missing  20000520  1372636854  A                false  [[-8.574678,41.151951],[-8.57470…
       5 │ 1372637091620000337  C              missing       missing  20000337  1372637091  A                false  [[-8.645994,41.18049],[-8.645949…
       6 │ 1372636965620000231  C              missing       missing  20000231  1372636965  A                false  [[-8.615502,41.140674],[-8.61485…
       7 │ 1372637210620000456  C              missing       missing  20000456  1372637210  A                false  [[-8.57952,41.145948],[-8.580942…
       8 │ 1372637299620000011  C              missing       missing  20000011  1372637299  A                false  [[-8.617563,41.146182],[-8.61752…
    ⋮    │          ⋮               ⋮           ⋮            ⋮           ⋮          ⋮          ⋮           ⋮                        ⋮
 1710664 │ 1388660427620000585  C              missing       missing  20000585  1388660427  A                false  [[-8.60697,41.162283],[-8.60697,…
 1710665 │ 1390403767620000911  C              missing       missing  20000911  1390403767  A                false  []
 1710666 │ 1404171463620000698  C              missing       missing  20000698  1404171463  A                false  [[-8.612469,41.14602],[-8.612487…
 1710667 │ 1404171367620000670  C              missing       missing  20000670  1404171367  A                false  [[-8.610138,41.140845],[-8.61017…
 1710668 │ 1388745716620000264  C              missing       missing  20000264  1388745716  A                false  []
 1710669 │ 1404141826620000248  B              missing            12  20000248  1404141826  A                false  [[-8.630712,41.154885],[-8.63073…
 1710670 │ 1404157147620000079  B              missing            34  20000079  1404157147  A                false  [[-8.615538,41.140629],[-8.61542…
We can see that we have roughly 2 million trips and the most important column is POLYLINE which contains a list of GPS coordinates.
What do we want to visualize?
I want to retrieve information about the city street layout using the data by visualizing the speed of the cabs and hopefully obtain a good view of motorways, the coastline and maybe some other interesting streets. Additionally, I want to do some animation with it for example building up the map by changing timestamp.
Achieving our goal consists of the following steps:
We need to convert the GPS coordinates to pixel coordinates (more precisely Luxor coordinates as that is the backend of Javis)
Maybe filter the data if there are some outliers
Calculate the speed of a cab between two points
colorize the corresponding line accordingly
I think we can directly go into using Javis and simply "animate" a single frame.
Therefore, let's start with our normal boilerplate code:
using Javis

function ground(video, args...)
    background("black")
    sethue("white")
    # bottom left corner is now at 0, 0
    translate(-video.width/2, -video.height/2)
end

function main(trips)
    vid = Video(1000, 1000)
    nframes = 1
    Background(1:nframes, ground)
    porto = Object(1:nframes, draw_trips(vid, trips))

    render(vid; pathname=joinpath(@__DIR__, "images/test.gif"))
end
We need to define the draw_trips function which takes the video and the trips itself. The video is needed to scale the coordinates to the specified video width and height.
function draw_trips(vid, trips)
    @JShape begin
        for i in 1:nrow(trips)
            trip = trips[i,:]
            draw_trip(vid, trip)
        end
    end
end
Here we simply iterate over the trips and call draw_trip. Another function we need to specify 😉
First we want to read the string of the POLYLINE column and convert it into an array of Luxor
Point
s. We use the JSON3 package to convert the string to a list of arrays. Then we iterate over them to fill our vertices array with Point as the element type.
function draw_trip(video, trip)
    json = JSON3.read(trip.POLYLINE)
    isempty(json) && return
    vertices = Vector{Point}(undef, length(json))
    for (i,vertex) in enumerate(json)
        vertices[i] = Point(vertex...)
    end
end
Next up we want to convert the GPS coordinates to pixel coordinates given a bounding box of GPS coordinates and the width and height of our gif. For this I search on google maps a bit and defined the bounding box as follows in the global scope.
const minlat = 41 # most southern part
const minlon = -8.8
const maxlat = 41.3 # most northern part
const maxlon = -8.4
Then we can do the conversion like this in the draw_trip function.
abs_lat = abs(minlat-maxlat)
abs_lon = abs(minlon-maxlon)

vertices = [Point(
                (vertex.x-minlon)*(video.width/abs_lon),
                (maxlat-vertex.y)*(video.height/abs_lat)
            ) for vertex in vertices]
Now we can simply draw the open polygon like this:
poly(vertices, :stroke)and get the following when calling main(trips)
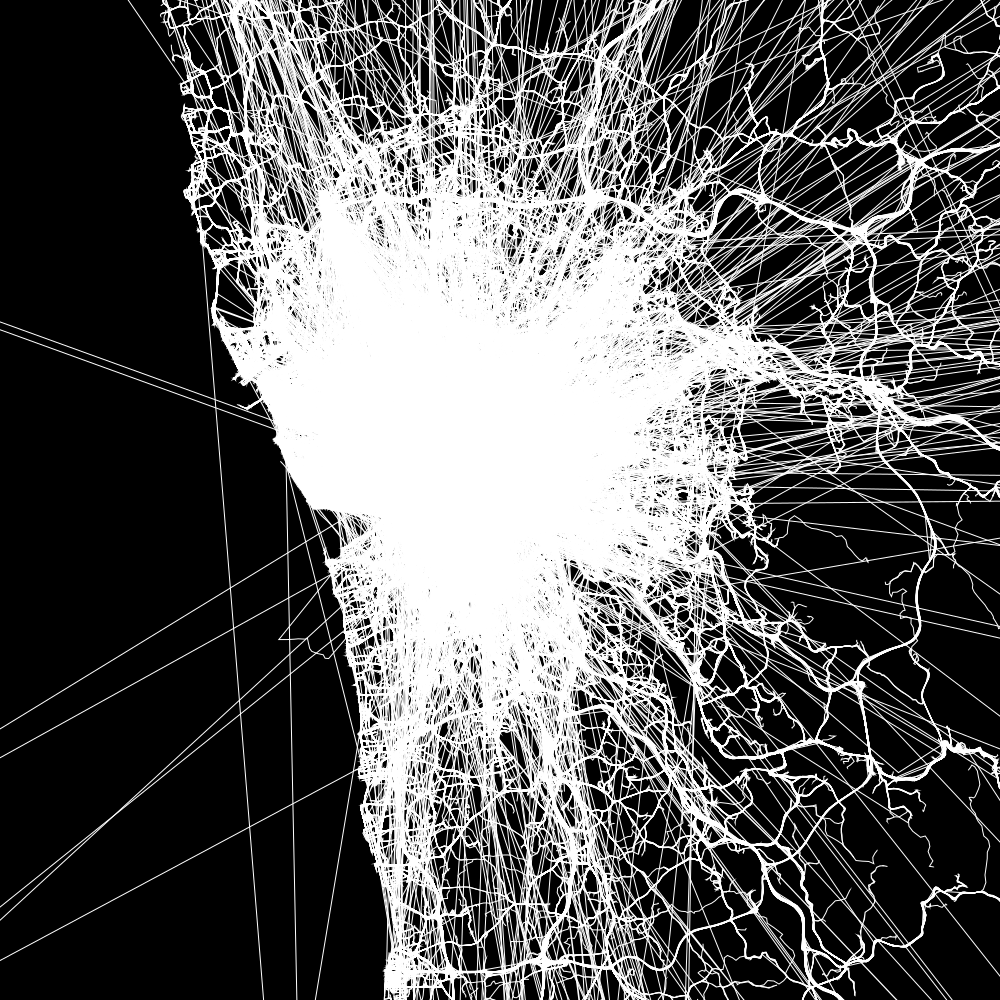
Which is quite a mess of lines. You can however see the coastline already and it seems like some coordinates are just not valid which creates these long lines. The idea now is to simply remove trips in which the car would drive faster than let say 150km/h.
First we need to calculate the distances for each line. We do this before we change the GPS coordinates to pixel values.
dists = [get_dist(p1, p2) for (p1, p2) in zip(vertices[1:end-1], vertices[2:end])]For the get_dist function we need two other packages Geodesy and Unitful.
function get_dist(p1, p2)
    p1_lla = LLA(p1.y, p1.x, 0.0)
    p2_lla = LLA(p2.y, p2.x, 0.0)
    return euclidean_distance(p1_lla, p2_lla)*u"m"
end
We then want to convert the dists to speeds which can also be done with Unitful.
speeds = dists ./ 15u"s"
any(speeds .> 150u"km/hr") && return
It's the first time I use Unitful and I have to say. I love it ❤ One thing I tripped over though is that it has to be u"km/hr" and not u"km/h" as h is Planck's constant.
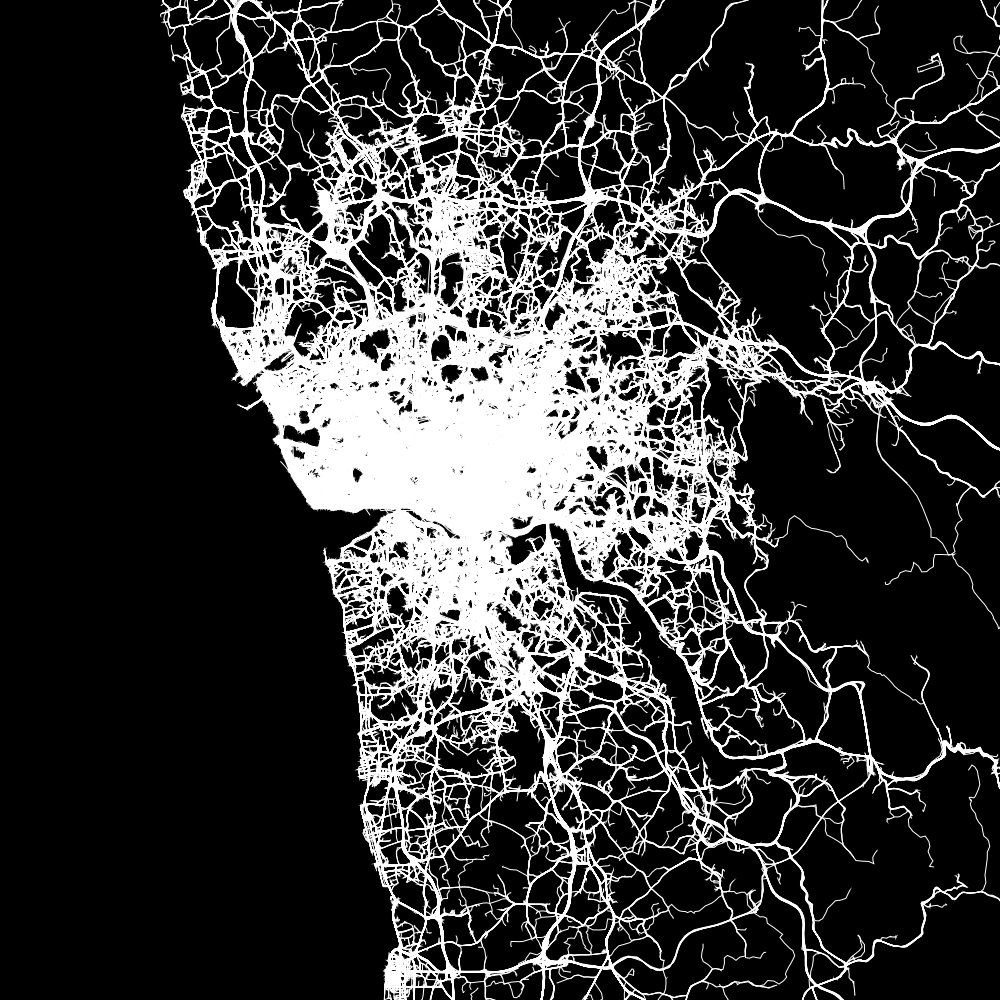
Going through every trip takes quite a while so let's change that to 200ths trip.
for i in 1:200:nrow(trips)
    trip = trips[i,:]
    draw_trip(vid, trip)
end
Colorize
This is probably the step which can be done it more beautiful ways by people who work with colors every day. I'm often stuck when I have to name more than 5 colors which are visually appealing, different enough from each other and are valid color names in Julia.
First step is to not use the poly function as we want to color each line segment individually.
poly(vertices, :stroke)becomes:
speeds_kmh = ustrip.(u"km/hr", speeds)
for (v1, v2, speed) in zip(vertices[1:end-1], vertices[2:end], speeds_kmh)
    line(v1, v2, :stroke)
end
Now we can play around with yet some another packages Animations and Colors which we have used in various other Javis posts already. For this part we unfortunately need the speed converted to floats which is why I created speeds_kmh before.
color_scale = Animation(
    [0, 30, 50, 90],
    [colorant"black", colorant"red", colorant"yellow", colorant"white"],
    [linear() for i in 1:3]
)
In our loop we can now set:
sethue(color_scale(speed))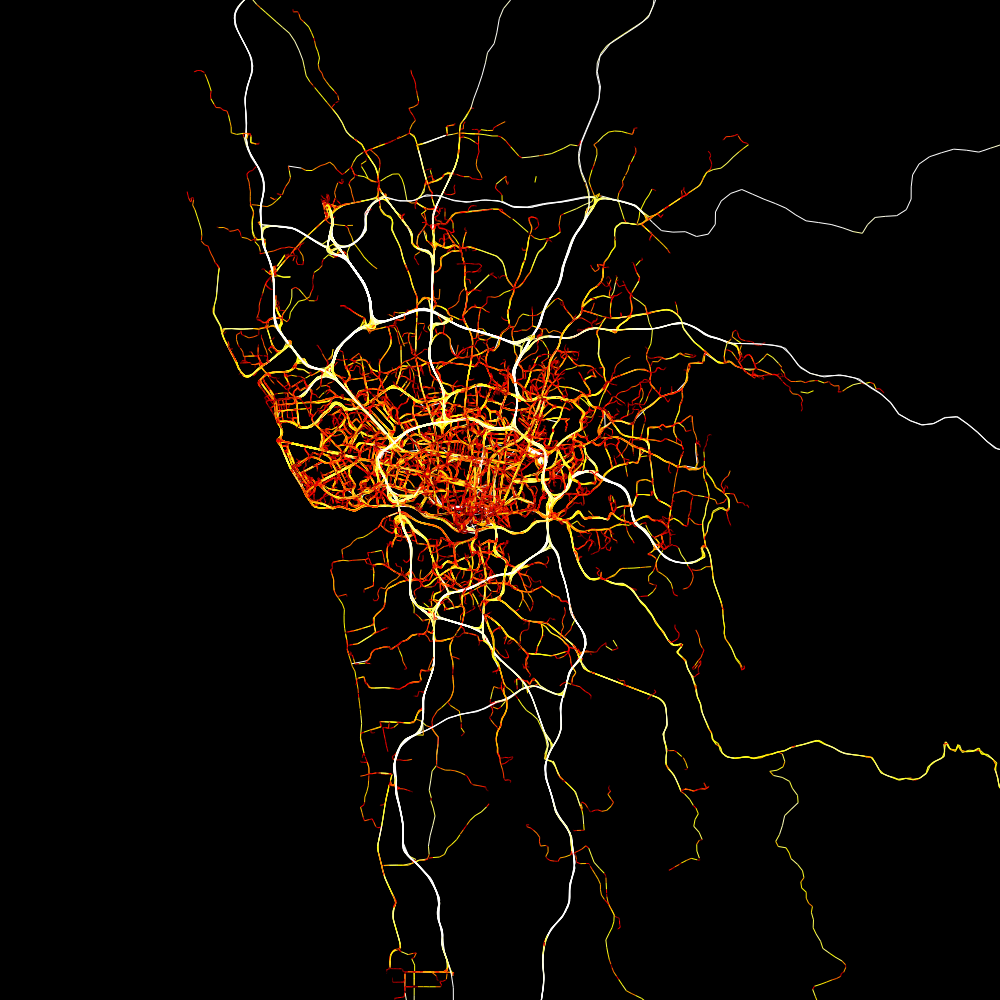
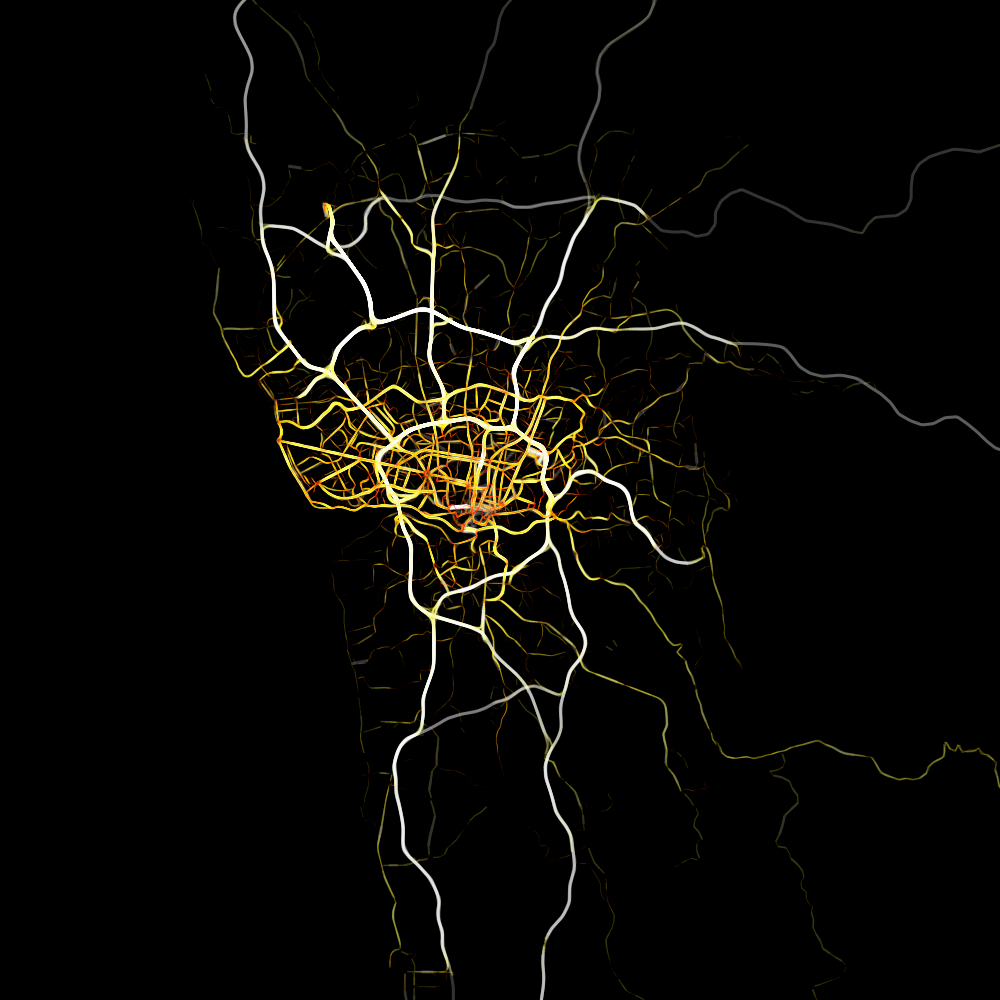
which already looks quite nice I think. Though I prefer to have it a little bit darker overall and the white motorways probably a bit wider.
line_scale = Animation(
    [0, 30, 50, 90],
    [0.0, 0.1, 1.0, 3.0],
    [Animations.linear() for i in 1:3]
)
setopacity(0.2)
and setline(line_scale(speed)) inside the loop.
Okay now it's finally time to animate it.
Action!
For the animation I want to play a bit with the timestamp which is given in the data. It's the timestamp of the first coordinate. I would like to visualize the trips as they happened and for each trip only show the part until a given maximum timestamp.
Therefore we need the
change
function and a bit more power of the
@JShape
macro.
The following goes in the main function.
min_timestamp, max_timestamp = extrema(trips.TIMESTAMP)
max_timestamp += 3600 # add another hour as we want the end time here
porto = Object(1:nframes, draw_trips(vid, trips; max_timestamp=min_timestamp))

act!(porto, Action(1:nframes, change(:max_timestamp, min_timestamp => max_timestamp)))
and replaces the previous porto = Object line and change nframes to 60 for now.
Then for draw_trips we need to work with the new argument max_timestamp and give it as an argument to draw_trip like this:
function draw_trips(vid, trips; max_timestamp=0)
    @JShape begin
        for i in 1:100:nrow(trips)
            trip = trips[i,:]
            if trip.TIMESTAMP < max_timestamp
                draw_trip(vid, trip, (max_timestamp-trip.TIMESTAMP)/15)
            end
        end
    end max_timestamp=max_timestamp
end
That gives us the maximum number of lines we should draw for that trip as each line is 15s long. I named that argument max_len for the following:
for (i, v1, v2, speed) in zip(1:length(speeds_kmh), vertices[1:end-1], vertices[2:end], speeds_kmh)
    i > max_len && break
    sethue(color_scale(speed))
    setline(line_scale(speed))
    line(v1, v2, :stroke)
end
Let's create a more gif like version of this by changing the max_timestamp back to the min_timestamp for the second half... well or we could simply use a postprocessing function 😉
render(vid; postprocess_frames_flow=(frames)->[frames..., reverse(frames)...], pathname=joinpath(@__DIR__, "images/test.gif"))I have changed back to 30 frames for this to keep the size of the gifs "small" and also I think it looks cooler 😄

One last animation
One last thing I would like to try out is to visualize the different days of the week. For this we need the Dates package and the
unix2datetime
function.
The needed changes for that are basically:
date = unix2datetime(trip.TIMESTAMP)
if trip.TIMESTAMP < max_timestamp && (weekday == 0 || weekday == dayofweek(date))
in the draw_trips function.
Feel free to experiment around with it yourself like change the hour instead of the weekday will probably be more interesting.
You can find the code here
Thanks everyone for reading and hope to see you soon.
Please checkout some other posts if you enjoyed this one. You can see the categories in the navbar on the left.
I think you might enjoy:
Special thanks to my 12 patrons!
Special special thanks to my >4$ patrons. The ones I thought couldn't be found 😄
Anonymous
Kangpyo
Gurvesh Sanghera
Szymon Bęczkowski
Colin Phillips
Jérémie Knuesel
For a donation of a single dollar per month you get early access to these posts. Your support will increase the time I can spend on working on this blog.
There is also a special tier if you want to get some help for your own project. You can checkout my mentoring post if you're interested in that and feel free to write me an E-mail if you have questions: o.kroeger <at> opensourc.es
I'll keep you updated on Twitter opensourcesblog.