Improving on the current Santa Kaggle Challenge: MIP and swapping
Creation date: 2019-12-10

This is the second post on this years Santa Kaggle Challenge.
Haven't read the first? -> Here you go!.
I wanted to blog more about it without sharing too many details as people might get mad, understandably. Unfortunately I fell back into competing mode and not into blogging mode. Sorry about that.
Feeling especially bad for my patrons as I also didn't continue with my constraint solver posts. The gamification of Kaggle is too strong for me... Therefore I decided to not charge my patrons this month. My Christmas gift :)
In this post I want to share what have changed since last time by summarizing some ideas that came up in the forums and a bit about my own approach but I'll not share code for that. Hopefully I will find the time to share all my code in a more structured way after the challenge. It would also be nice to know if someone wants to chat after the challenge and tell me about their ideas. That would be wonderful!
If you find any of this information useful and want to read more please comment and if you're generally interested in optimization please check out other posts I wrote:
How to build a constraint solver which is my latest long term challenge/series.
and many more
I don't wanna beg for your money but if you consider to buy a second yacht you might give me some of your dollars ;) You can donate via Patreon or PayPal.
Okay let's start
I said last time that I want to take about linear programming for a bit.
A small recap on the problem: We want to match 5,000 families to 100 days and we want to minimize two types of costs. The preference costs which depend on how happy we can make the families (before giving them money) and the accounting costs which are an indication of how smooth the change between days is considering the number of people per day.
In mathematical terms: Preference costs:
\[ \sum_{f \in F} \sum_{d \in D} \text{prefcost}_{f,d} x_{f,d} \]Here prefcost depends on the preferences of each family and is a matrix of size \(5,000 \times 100\) and \(x_{f,d}\) describes the binary decision variable whether family \(f\) visits the workshop of Santa on day \(d\).
The accounting costs:
\[ \sum_{d=100}^{1} \frac{\left(N_{d}-125\right)}{400} N_{d}^{\left(\frac{1}{2}+\frac{\left|N_{d}-N_{d+1}\right|}{50}\right)} \]Here \(N_d\) is the number of people assigned to day \(d\). The preference cost is a linear function and is relatively easy. In that formulation it need still a lot of decision variables but okay.
Before we start with the linear program we might wanna have a short look at the accounting cost. Can it get huge? Like do we need to care about it? Or when is it small? Is there a way to linearize it?
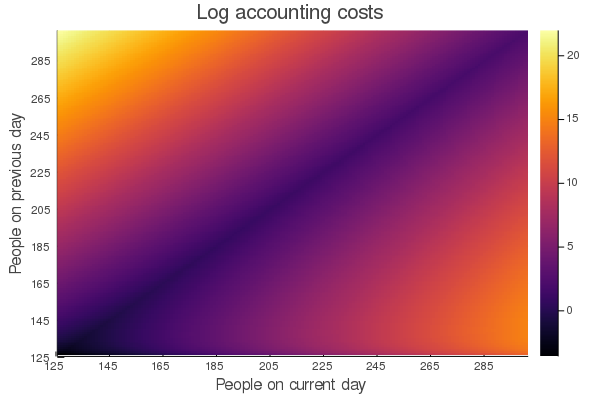
Easy to visualize with Julia:
using Plots
acc(N,N1) = ((N-125)/400)*N^(0.5+abs(N-N1)/50)
acc_mat = zeros(176,176)
for i=125:300, j=125:300
    acc_mat[i-124,j-124] = acc(i,j)
end
heatmap(log.(acc_mat);
    title="Log accounting costs",
    xaxis="People on current day", yaxis="People on previous day",
    xticks=(0:20:175, string.(collect(125:20:300))),
    yticks=(0:20:175, string.(collect(125:20:300))))
We want to minimize it which means we are interested in the darker areas. Attention: It is a log plot so the yellow areas are very very bad. I think I should have added "very" more often ...
A special thing which we can't easily see in that representation is that if the current day is 125 we don't need to care about the people on the previous day. (Previous means \(N_{d+1}\) as we are counting backwards to Christmas).
It doesn't seem to be easy to linearize it but maybe we can allow some changes like maximal 20 people difference or something.
acc(200,220) ~ 22.08There is actually a way to linearize the whole system by introducing more variables which is interesting to get a lower bound on the problem ;) Read more about it here
More visualizations about the costs in this awesome notebook.
For this post I want to change the hungarian method stuff from last time and convert it into a mixed integer program formulation.
If you want to read a bit more about how stuff like this works you might want to check out my posts on:
It's quite easy to write it down using JuMP.jl so we might wanna do a simple implementation without sharing the code for details on how to make it actually useable. I'll share the ideas ;)
using JuMP, Cbc

include("score.jl")
function mip()
    preference_mat = get_preference_mat();

    # sharing three numbers with you. Maybe they are not even good :D
    start_people_per_day = [300, X, X, X, X, X, X,
                            X, X, X, X, X, X, X,
                            X, X, X, X, X, X, X,
                            X, X, X, X, X, X, X,
                            X, X, X, X, X, X, X,
                            X, X, X, X, X, X, X,
                            X, X, X, X, X, X, X,
                            X, X, X, X, X, X, X,
                            X, X, X, X, X, X, X,
                            X, X, X, X, X, X, X,
                            X, X, X, X, X, X, X,
                            X, X, X, X, X, X, X,
                            X, X, X, X, X, X, X,
                            X, X, X, X, X, X, X, 125, 125]

    a3c = accounting_cost(start_people_per_day)
    println("accounting_cost: ", a3c)

    dff = CSV.read("family_data.csv")
    n_people = dff[:, :n_people]
    m = Model()
    set_optimizer(m, with_optimizer(Cbc.Optimizer))
    # the 500,000 variables
    @variable(m, x[1:100, 1:5000], Bin)

    # the objective function which depends on the preference cost
    # and our currently constant term a3c = accounting costs
    @objective(m, Min, sum(sum(preference_mat[d,f]*x[d,f] for d=1:100) for f=1:5000)+a3c)

    # each family must have an assigned day
    for f=1:5000
        @constraint(m, sum(x[d,f] for d=1:100) == 1)
    end
    # each day needs exactly as many people as defined above
    for d=1:100
        @constraint(m, sum(x[d,f]*n_people[f] for f=1:5000) == start_people_per_day[d])
    end

    optimize!(m)

    # Interesting things for later
    # JuMP.objective_value(m) => getting the objective
    # x_val = round.(JuMP.value.(x)) => the rounded x values
end
I haven't actually run this til the end but it might take like an hour or so for Cbc. If you just wanna test it out on your own and not competing for money on Kaggle as well as being a student: You might wanna check out Gurobi.
How can that be improved?
Thinking about the accounting costs a bit more maybe ;)
Do we actually need 500,000 variables? What if we don't have families that don't get one of their favorite choices?
Other ideas:
I got deeper into the swapping territory. Last time I only did upgrading a family into another day if I remember correctly. How about Swapping two families or three, four,... and maybe doing family A moves to day of family B and B to day of family C but C stays where it is. We can of course do that in order but the number of possible swaps gets huge so I decided to use randomization for that. The most basic approach is: Do a change and compute the new score. If the new score is better than swap and don't swap otherwise. There are some problems here:
It's slow to compute the whole score over and over again
Maybe it is reasonable to make a worse change sometimes to get out of local minima
For the first point you need to think about: What changes for the swap? Do all preference cost change? How about the accounting costs? The latter is a bit trickier. You might find this discussion on Kaggle useful.
The second point is done in so called simulated annealing (Kaggle discussion)).
A bit about my current process
I try to swap (or doing A->day(B), B->day(C) to be more precise) on various length now and using simulated annealing. Some techniques to jump out of local minima and save all the solutions that I encounter on the way by their score and their hash as a lot of configurations have the same cost. I'm currently making about 1 million checks for swapping per second but have to further check out how to choose the temperature and how to fall back to a different solution to get out of local minima. My current best score is 70,829 and I definitely want that silver medal which means there is still some stuff to do ;)

Information about the table:
X => have I encountered the solution before (X -> yes in this run, F -> not but before (a file exists already))
c => just a counter
f => a factor for the accounting costs: Maybe increase them slowly?
k => Swapping length
n c => number of choices I consider
temp => the temperature for simulated annealing. Something I probably have to tune
under70 h => hours until I get below 70,000 (not a good estimate)
cps => swapping checks per second
hash => hash of the current solution
If you want to do some reverse engineering on my hashes and scores ... ;)
I would like to build a graph with all my solutions and how they are connected in an interactive way.
The ideal scenario would be that given the information every team can visualize their procedure easily if they do swapping techniques.
You can click on a solution to get a visual representation of the solution. Like happiness of the families in color on a bar chart and click on a different connected solution to see the swaps in action.
Sometimes I get fascinated by those visualizations instead of focusing more on the actual challenge ;)
Hope you got some useful information out of this post! Enjoy competing ;)
I should mention that the Optimum has been reached see: Post by Vlado Boza!
What's next?
I normally write about constraint programming at the moment which you can check out here and currently trying to make it a JuMP.jl solver but have some difficulties.
New ideas for the Kaggle challenge:
More and better swapping?
Visualizations
Stay tuned ;)
And as always:
Thanks for reading and special thanks to my four patrons!
List of patrons paying more than 2$ per month:
Site Wang
Gurvesh Sanghera
Currently I get 9$ per Month using Patreon and PayPal when I reach my next goal of 50$ per month I'll create a faster blog which will also have a better layout:
Code which I refer to on the side
Code diffs for changes
Easier navigation with Series like Simplex and Constraint Programming
instead of having X constraint programming posts on the home page
And more
If you have ideas => Please contact me!
If you want to support me and this blog please consider a donation via Patreon or via GitHub to keep this project running.
For a donation of a single dollar per month you get early access to the posts. Try it out for the last two weeks of October for free and if you don't enjoy it just cancel your subscription.
If you have any questions, comments or improvements on the way I code or write please comment here and or write me a mail o.kroeger@opensourc.es and for code feel free to open a PR on GitHub ConstraintSolver.jl
I'll keep you updated on Twitter OpenSourcES as well as my more personal one: Twitter Wikunia_de
Want to be updated? Consider subscribing on Patreon for free