Visualizing Pi, Tau and prime numbers
Creation date: 2020-07-13

You might have seen the previous post where I showed a visualization of the first 1,000 digits of \(\pi, \tau\) and \(\sqrt{2}\). Check it out!
It followed after a small debate whether \(\tau\) is better than \(\pi\). There are endless debates about it and I thought I can make a joke vote about it.
In this post I want to show how I created the visualizations and hope you might wanna try the awesome package Luxor.jl after you have read this. Yesterday I started reading the tutorial, which is awesome! I did visualize \(\pi\) before in the way I show you now, but last time it was in Javascript and I thought it's a neat little project to start learning Luxor. As mentioned in let me be your mentor: I think it's important to have such little projects to learn a new tool.
The idea
I wanted to recreate a visualization I've seen on Numberphile. It shows visualizations by Martin Krzywinski.
It consists of a circle (which of course fits to \(\pi\) and \(\tau\)) and is split into 10 segments, one for each digit. The digits of our irrational number are visualized by curves inside that circle such that 3.1415 (I start with 14) is a curve from the 1 segment to the 4 segment and then back to 1 to 5 and so on. Each time we move a bit clockwise in the segment such that 1->4 creates different curves (depending on the current position we are at).
I'll later add some more features to it. First we need to be comfortable with Luxor.jl.
Important: It shouldn't have a mathematical interpretation it's just a small visualization project ;)
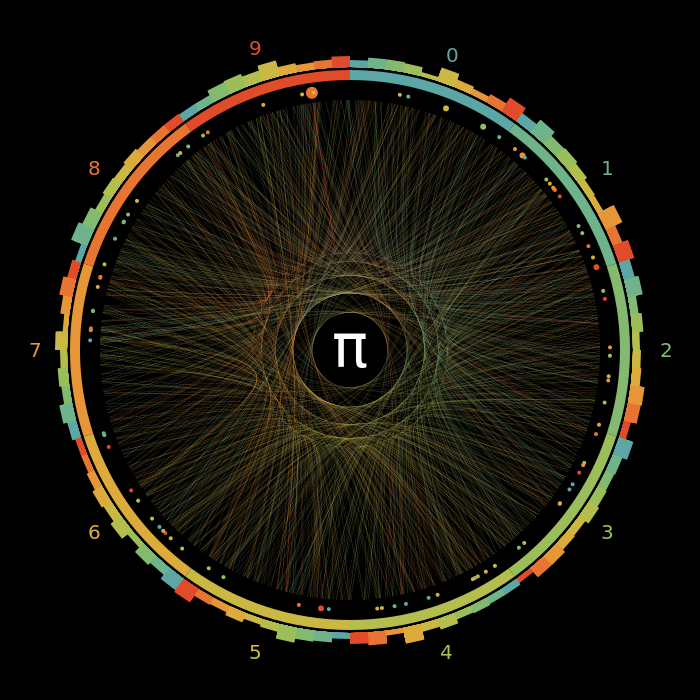
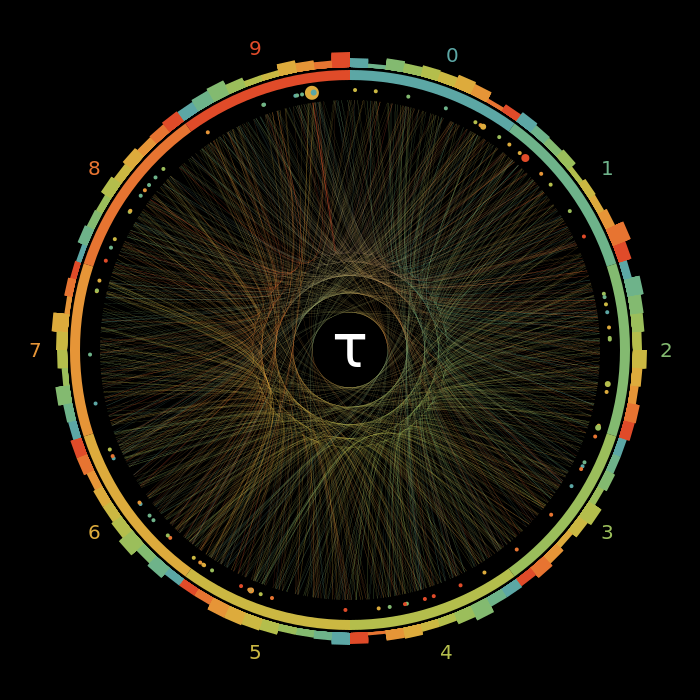
I know you're curious how the end result should look like:
Getting started
using Luxor

function vis()
    @png begin
        sethue("black")
        circle(O, 50, :stroke)
        setdash("dot")
        circle(O, 70, :stroke)
        sethue("darkblue")
        circle(O, 10, :fill)

    end 500 200 "./start.png"
end
calling vis() then creates start.png which looks like:

Let's go through the commands really quick:
@png begin
end width height "filename.png"
is just a nice macro. :)
sethue sets a color and takes either a string as shown above or a color from the Colors package for example. It sets the color for the next drawing commands until you change the color. Same is true when setting the line width with setline or setting font size or other general settings.
Drawing commands like circle normally take some parameters and end with an action parameter like :stroke or :fill.
The O is the letter O not the number O :) It represents the origin and is a short form for Point(0, 0). In Luxor the origin is in the middle of the canvas. A radius must be given as the second parameter.
Let's draw the outer circle first and add the digits:
radius = 100
@png begin
    background("black")

    sethue("white")
    circle(O, radius, :stroke)

    for i in 0:9
        θ = 2π*0.1*i+0.1*π
        mid = Point(
            radius*sin(θ),
            -radius*cos(θ),
        )
        label(string(i), :N, mid)
    end

end 700 300 "./first_step.png"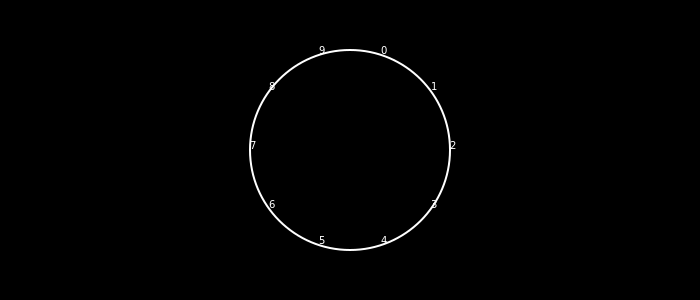
The first part should be quite straightforward.
θ = 2π*0.1*i+0.1*πmight not be ideally written (besides that I might wanna use \(\tau\) :D). The 2π*0.1*i will start at the north position and then for the next i it will move by \(36\degree\). I add 0.1π because I want to move to the middle of each segment. Maybe it should be written 0.5/10*2π. Then we basically have to rotate our canvas and move by the radius in the top direction to draw the label. It can be actually done this way in Luxor using rotate and translate. I've decided for this as I needed that way for later anyway. In general the formula is:
when rotating the canvas by \(\theta\) and then translating by x,y. As I only translate by y I don't need the first term. Remember that y is increasing when going down.
Currently there are two problems:
we actually don't need the circle, we need arcs (segments) for each digit
the labels are unreadable
The label command takes three values: the text, rotation and position where the rotation can be written as :N, :E, :S, :W for north, east, south, west or as an angle (in radians). :N is \(-\frac{\pi}{2}\). Therefore we want to start with \(-\frac{\pi}{2}\) and add the current angle of rotation to it. Additionally, an offset would be great to not be directly on the cycle or too close to it. Here we could increase the radius or use ; offset in the label command.
For the first problem, we need the arc2r function which takes three arguments + action. c1, p1, p2: c1 is the center of the circle and p1 and p2 are the points on the circle between which the segment should be shown. It's using the clockwise direction.
We define the following function to get the \(\theta\) and the corresponding point in an easier way:
function get_coord(val, radius)
    θ = 2π*0.1*val
    return Point(
        radius*sin(θ),
        -radius*cos(θ),
    )
end
and then:
background("black")

for i in 0:9
    from = get_coord(i, radius)
    to = get_coord(i+1, radius)
    randomhue()

    θ = 2π*0.1*i+0.1*π
    mid = Point(
        radius*sin(θ),
        -radius*cos(θ),
    )
    label(string(i), -π/2+θ, mid; offset=15)
    move(from)
    arc2r(O, from, to, :stroke)
end
I've used randomhue to get a random color. We will fix that next :) I also rearranged the order of label and arc2r and put a move in there as otherwise some lines are drawn from the label to the arc. This is because an arc continues the current path.

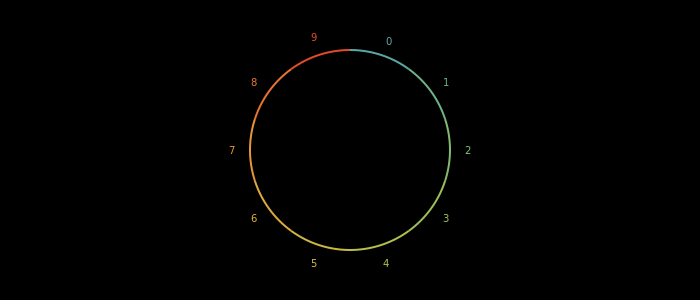
That looks much better! Let's get some nice colors from Colorschemes.jl.
I used the scheme rainbow starting with the 7th color :D You might want to experience with other color schemes as here the colors are not that easy to distinguish but I still somehow like it.
using ColorSchemes
colors = ColorSchemes.rainbow[7:end]
and later
sethue(colors[i+1])remember that the array is 1 index based in Julia.
What are the next steps?
Adding the lines
Refactoring code
Animate the process
Add the dots
Add the bar chart on top
I think it's visually appealing the have the circle in the middle where we can add the \(\pi\) (or \(\tau\)) symbol later. Therefore we can't draw straight lines from one segment to another. I'm using quadratic bezier curves for that.
Let's get the digits of pi first:
max_digits = 10
digits = setprecision(BigFloat, Int(ceil(log2(10) * max_digits+10))) do
    return parse.(Int, collect(string(BigFloat(pi))[3:max_digits+2]))
end
this gives us the first 10 digits after the decimal point of pi. I need to set the precision of BigFloat for that. It's quite interesting that pi isn't a hard coded constant in Julia. It's computed such that I can basically get any precision I want. The precision must be given in number of bits such that a small calculation must be done. I've added the +10 in the end to be sure :D
To draw the quadratic bezier curve we need three points. Start, end and a control point. As the control point I'm choosing a point on an inner circle which is basically also split into ten segments and I choose the segment which is in the middle between the current digit from_val and the next digit to_val.
I have to clarify what I mean by middle: The mid point between 0 and 4 should be 2 but between 8 and 0 it should be 9. This is determined by the shortest way from one to the other in our circle and there the middle.
Also I don't really have 10 discrete segments it's just for understanding. I can use a mid point of 1.23 or something. This is used because we change our start and end position based on the current position we are in our digits array.
I hope this is clearer when having a look at the code:
small_radius = 70
for i in 1:max_digits-1
    from_val = digits[i]
    to_val = digits[i+1]
    sethue(colors[from_val+1])

    f = from_val+(i-1)/max_digits
    t = to_val+i/max_digits

    from = get_coord(f, radius)
    to = get_coord(t, radius)

    # get the correct mid point for example for 0-9 it should be 9.5 and not 4.5
    mid_val = (f+t)/2
    mid_control = get_coord(mid_val, small_radius)
    if abs(f-t) >= 5
        mid_control = get_coord(mid_val+5, small_radius)
    end

    pts = Point[from, mid_control, mid_control, to]
    bezpath = BezierPathSegment(pts...)
    drawbezierpath(bezpath, :stroke, close=false)
end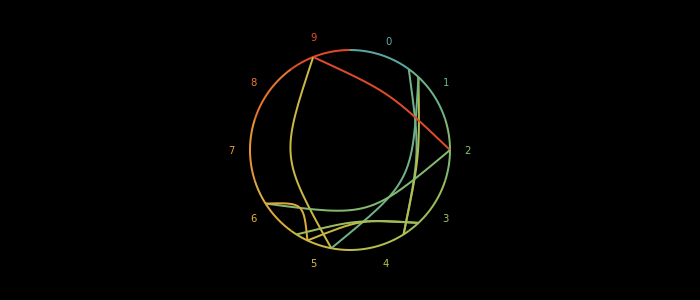
I think that looks already reasonably well. The color now shows us the color of the from digit. So we go from 9 to 2 at one point. I would instead like to see where we are going and where we are coming from. This can be done with blend and setblend. It's a linear blend between from and to so not really along the curve but it's good enough I think.
setblend(blend(from, to, colors[to_val+1], colors[from_val+1]))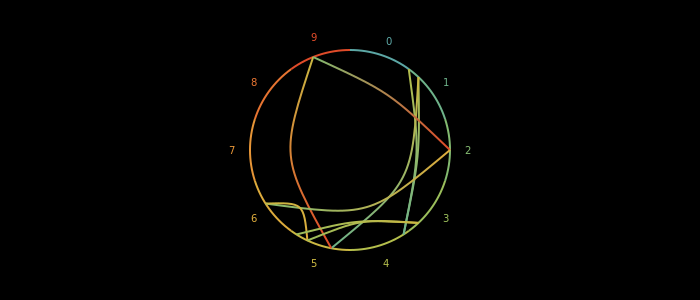
It's similar to sethue so we need to place it at some point before we call drawbezierpath.
Let's get some more digits in and decrease the line width a little.
In front of the loop: setline(0.1)
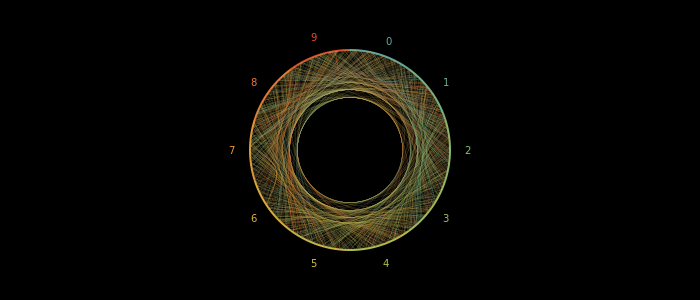
Okay I think the inner radius is a bit big:
small_radius = 40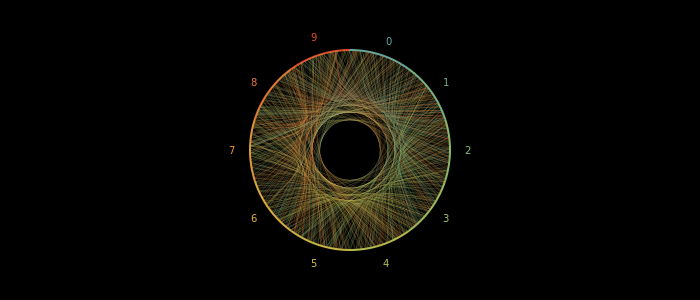
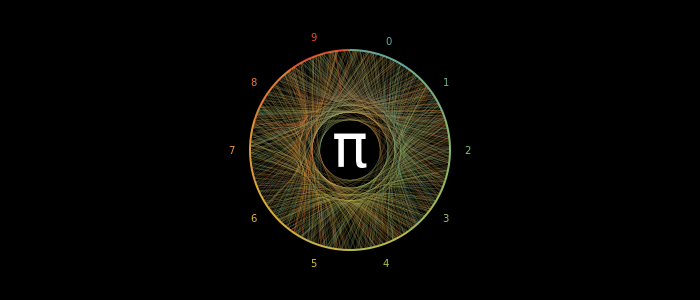
Then we can add the \(\pi\) in the middle before we clean the code a little to create our first animation.
Luxor.jl has no support for LaTeXStrings.jl which is a bummer but we can use UnicodeFun.jl.
using UnicodeFun
center_text = to_latex("\\pi")
and in between the loops I put:
sethue("white")
fontsize(60)
text(center_text, Point(-2, 0), valign=:middle, halign=:center)
I found Point(-2, 0) is more central then Point(0, 0) or O.
Animation
I would like to get a gif out of the visualization pipeline such that in each frame a new line is added.
In Luxor this can be done with the animate function which takes several scenes and their frame numbers. This will also provide a little bit more structure to the code.
We can have a scene for the steady background and one for the lines.
Before we write the function let's define a very short animation to see how it's done.
function draw_background(scene, framenumber)
    background("black")
end

function circ(scene, framenumber)
    setdash("dot")
    sethue("white")
    translate(-200, 0)
    @layer begin
        translate(framenumber*2, 0)
        circle(O, 50, :fill)
    end
end

function anim()
    anim = Movie(600, 200, "test")

    animate(anim, [
        Scene(anim, draw_background, 0:200),
        Scene(anim, circ, 0:200),
    ],
    creategif = true,
    pathname = "./test.gif"
    )
end
First we create a Movie with width, height and a name. Then we call animate with that created Movie and a list of scenes which consist of the movie again then a function and a range of frames starting at 0.
This basically calls draw_background(scene, 0) and circ(scene, 0) for the first frame. The scene can contain some arguments which we will use for our animation. The rest is basically as before just that we can of course use the framenumber variable.
I'll split it up into functions now and define variables like the digits we want to visualize such that we can visualize \(\tau\) or others more easily.
The complete code:
using Luxor, ColorSchemes
using UnicodeFun

function get_coord(val, radius)
    θ = 2π*0.1*val
    return Point(
        radius*sin(θ),
        -radius*cos(θ),
    )
end

function draw_background(scene, framenumber)
    background("black")

    radius = scene.opts[:radius]
    colors = scene.opts[:colors]
    center_text = scene.opts[:center_text]

    for i in 0:9
        from = get_coord(i, radius)
        to = get_coord(i+1, radius)
        sethue(colors[i+1])

        θ = 2π*0.1*i+0.1*π
        mid = Point(
            radius*sin(θ),
            -radius*cos(θ),
        )
        label(string(i), -π/2+θ, mid; offset=15)
        move(from)
        arc2r(O, from, to, :stroke)
    end

    sethue("white")
    fontsize(60)
    text(center_text, Point(-2, 0), valign=:middle, halign=:center)
end

function dig_line(scene, framenumber)
    radius = scene.opts[:radius]
    colors = scene.opts[:colors]
    center_text = scene.opts[:center_text]
    bezier_radius = scene.opts[:bezier_radius]
    max_digits = scene.opts[:max_digits]
    digits = scene.opts[:digits]

    setline(0.1)

    for i in 1:min(framenumber, max_digits-1)
        from_val = digits[i]
        to_val = digits[i+1]

        f = from_val+(i-1)/max_digits
        t = to_val+i/max_digits

        from = get_coord(f, radius)
        to = get_coord(t, radius)

        # get the correct mid point for example for 0-9 it should be 9.5 and not 4.5
        mid_val = (f+t)/2
        mid_control = get_coord(mid_val, bezier_radius)
        if abs(f-t) >= 5
            mid_control = get_coord(mid_val+5, bezier_radius)
        end

        pts = Point[from, mid_control, mid_control, to]
        bezpath = BezierPathSegment(pts...)
        # reverse the color to see where it is going
        setblend(blend(from, to, colors[to_val+1], colors[from_val+1]))
        drawbezierpath(bezpath, :stroke, close=false)
    end
end

function anim()
    anim = Movie(700, 300, "test")

    radius = 100
    bezier_radius = 40
    colors = ColorSchemes.rainbow[7:end]
    max_digits = 1000
    center_text = to_latex("\\pi")

    digits_arr = setprecision(BigFloat, Int(ceil(log2(10) * max_digits+10))) do
        return parse.(Int, collect(string(BigFloat(pi))[3:max_digits+2]))
    end

    args = Dict(:radius => radius,
        :bezier_radius => bezier_radius,
        :colors => colors, :max_digits => max_digits,
        :digits => digits_arr, :center_text => center_text
    )

    animate(anim, [
        Scene(anim, draw_background, 0:max_digits+50, optarg=args),
        Scene(anim, dig_line, 0:max_digits+50, optarg=args),
    ],
    creategif = true,
    pathname = "./pi_first.gif"
    )
end
The one thing I haven't explained yet is optarg in the Scene function and retrieving it with i.e. radius = scene.opts[:radius].
We kinda lost the option to create simple images. Therefore, I created a struct
struct PNGScene
    opts::Dict{Symbol, Any}
end
and use some arguments in the anim function which I rename to viz :D
Then I can use something like:
scene = PNGScene(args)
@png begin
    draw_background(scene, max_digits)
    dig_line(scene, max_digits)
end 700 300 "./$fname.png"
Don't worry there is a gist at the end where you can see the whole code. It is just a bit complicated to describe the changes here.
Should I have made a video on it? :D
Adding the Feynman point
We visualized the digit to digit connection using the curves but if we have something like 555 in the digits we would only see a line going in the direction of the center and back (or maybe we see two depending on our max digits, resolution etc)
Instead we can show an extra dot whenever this happens. This can be used with the function argument show_dots if you want to check my code ;)

I've just checked the length of the sequence and when it is longer than 1, I draw a circle where this happens and the color is the digit after that sequence. The big circle in in the 9er segment is the so called Feynman point where the digit 9 appears 6 times at position 762.
Adding the bar charts
Last thing on my list is to have a bar chart on each segment to give a feeling whether some pair combinations happen more often than others.
I use the poly function for this and with four points. Correctly it should be bounded by two arcs and not two lines but I leave that to the reader :)
Tau?
Yeah one could basically generate a random number with 1000 digits and get a similar result...
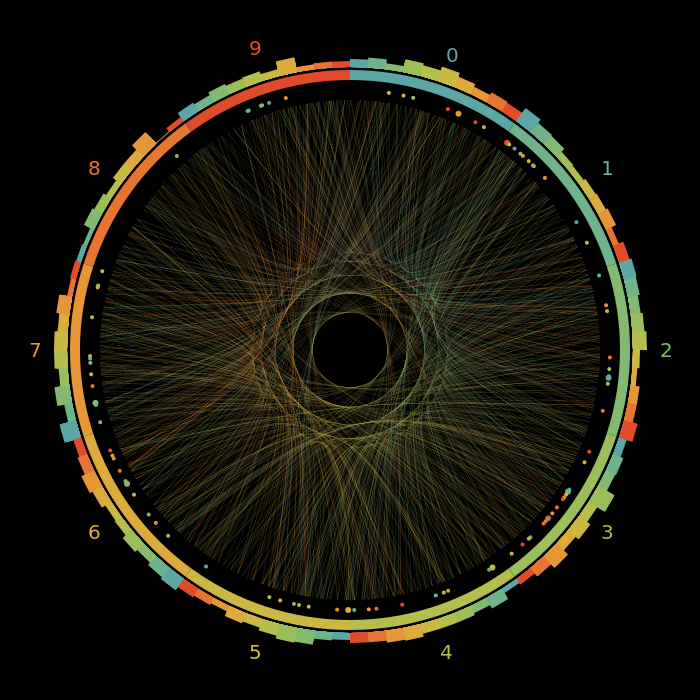
Prime numbers
This is a bit: Using our function to visualize something else such that some parts are not that reasonable anymore but it shows something quite interesting.
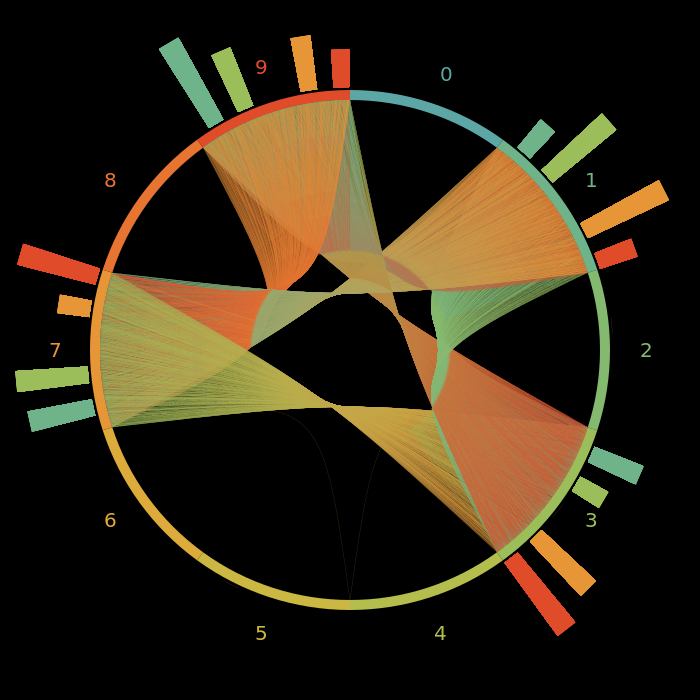
This uses the last digits of primes as the number sequence. I've visualized for primes under 100,000. The connection lines are a bit useless to be honest as most of the time (if we ignore the first few primes: all the time) only four digits are possible. That creates kind of a mess in the middle.
Nevertheless, the bars get more interesting I think:
It shows clearly that not all pairs are equally likely. Especially, if we have a prime \(p_n\) with the last digit x it's always less likely that the last digit of \(p_{n+1}\) also ends with an x compared to one of the other three options.
Let's focus on the bars and visualize primes under 10,000,000:
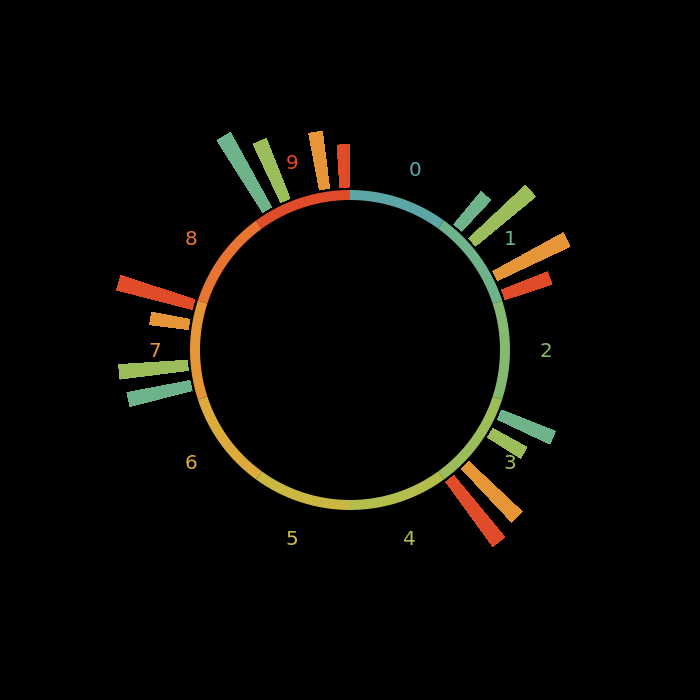
The pattern still holds.
Code
Okay here you go gist
I would like to create something like manim which is used and created by 3b1b in his videos.
At least a small simple versions with some handy visualization functions :)
Thanks for reading and special thanks to my 10 patrons!
List of patrons paying more than 4$ per month:
Site Wang
Gurvesh Sanghera
Szymon Bęczkowski
Logan Kilpatrick
Currently I get 28$ per Month using Patreon and PayPal.
For a donation of a single dollar per month you get early access to the posts. Try it out at the start of a month and if you don't enjoy it just cancel your subscription before pay day (end of month).
I'll keep you updated on Twitter OpenSourcES as well as my more personal one: Twitter Wikunia_de
Want to be updated? Consider subscribing and receiving a mail whenever a new post comes out.